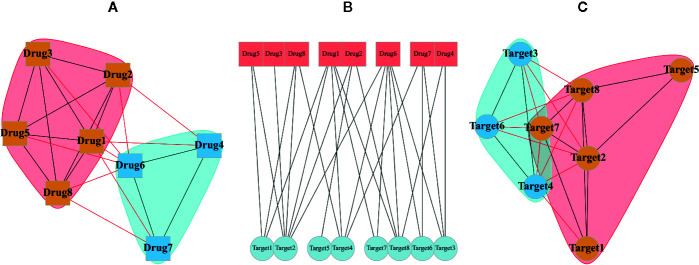
Figure 3.
A random bipartite graph or bigraph of drugs (square nodes) and targets (circular nodes) is represented along with two possible projections of it. The center graph (B) is a main bipartite graph by placing nodes in two different sets. The projection of drugs (A) and the projection of targets (C) are shown in which communities were identified via greedy optimization of modularity score.

