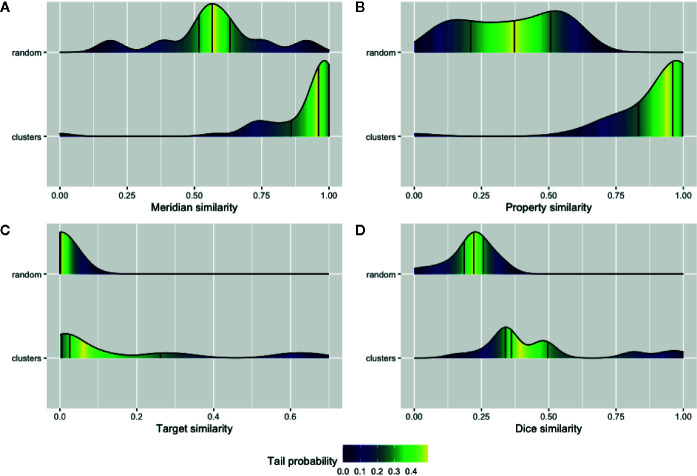
Figure 4.
Validation of the network communities in TCM herbs. The distribution of Meridian similarity (A) and Property similarity (B) within the communities of NSN (natural product similarity network) compared to random groups; The distribution of drug target similarity (C, D) the Dice index similarity within the communities of ISN (ingredient similarity network) compared to random groups. Lines indicate the quartiles values and gradient color represent the probability of values within the empirical cumulative density function for the distributions.

