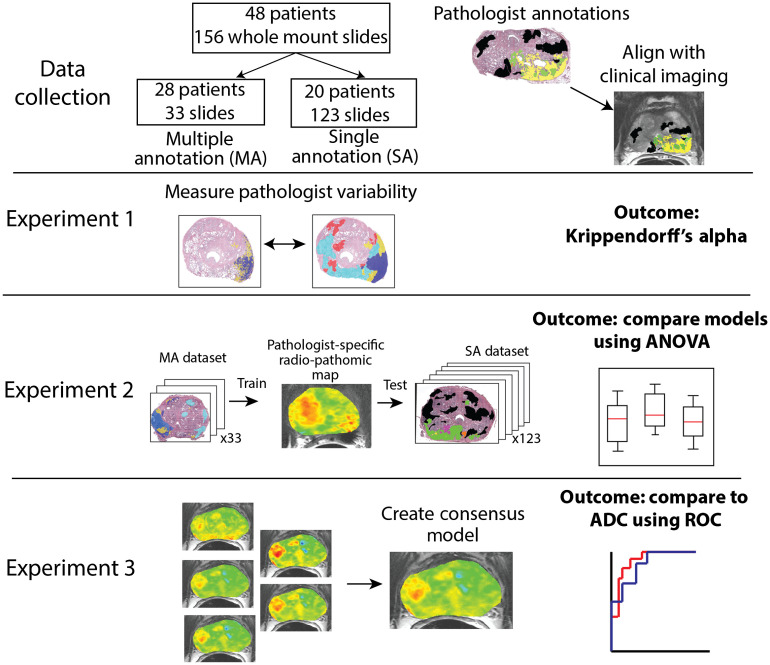
Fig. 2.
Experimental set up and outcomes of this study. In experiment 1, whole-mount annotations were compared between pathologists pair-wise using Krippendorff’s alpha. Experiment 2 trains pathologist-specific RPM models and compares the mean epithelium density values on a held-out test set. Experiment 3 combines the pathologist-specific models into a consensus model and compares the area under the ROC curve to ADC classifying high-grade tumors versus low-grade and benign regions.

