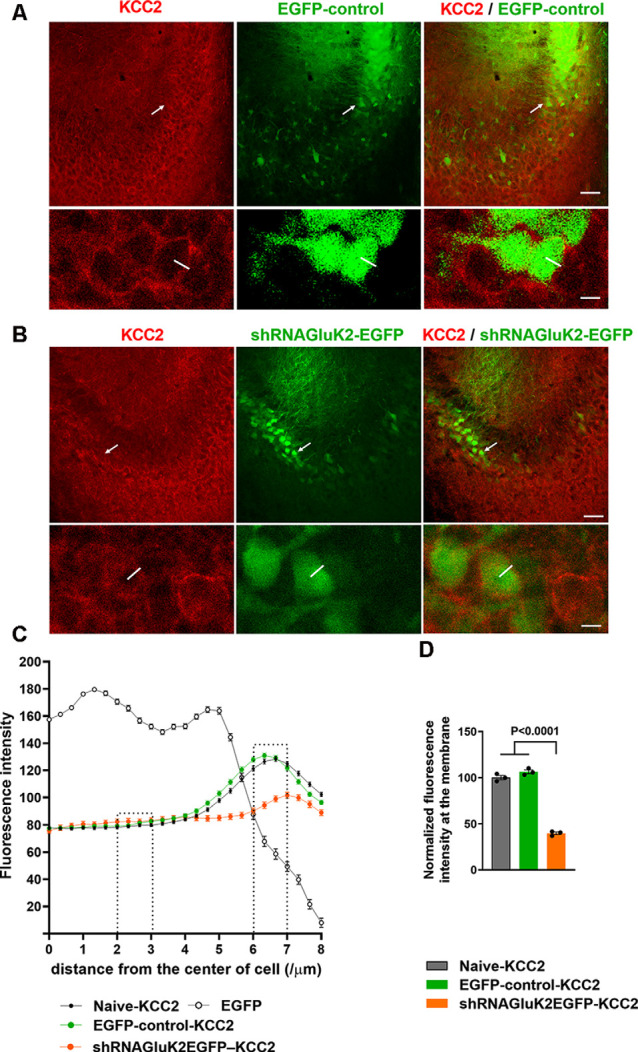
Figure 1.

Downregulation of K+-Cl− cotransporter (KCC2) after acute silencing of GluK2 in CA3 hippocampal neurons in vivo. (A,B) KCC2 immunostaining (in red) of CA3 hippocampal section from animals transduced with EGFP-control (A) or shRNAGluK2-EGFP (B) lentivirus. Lower panel shows a high magnification single confocal section of images of cells marked with a white arrow in the upper panel. (C) Graph showing the line intensity profile from the center of the cell. Examples of lines are shown in the inserts in (A). (D) Bar graph showing the normalized cumulative fluorescence intensity. The regions between 2–3 μm and 6–7 μm from the center of the cell were used for quantification. Data are presented as mean ± SEM (p < 0.0001 considered significant). Scale bar: 100 μm (low magnification panels) and 20 μm (insert).
