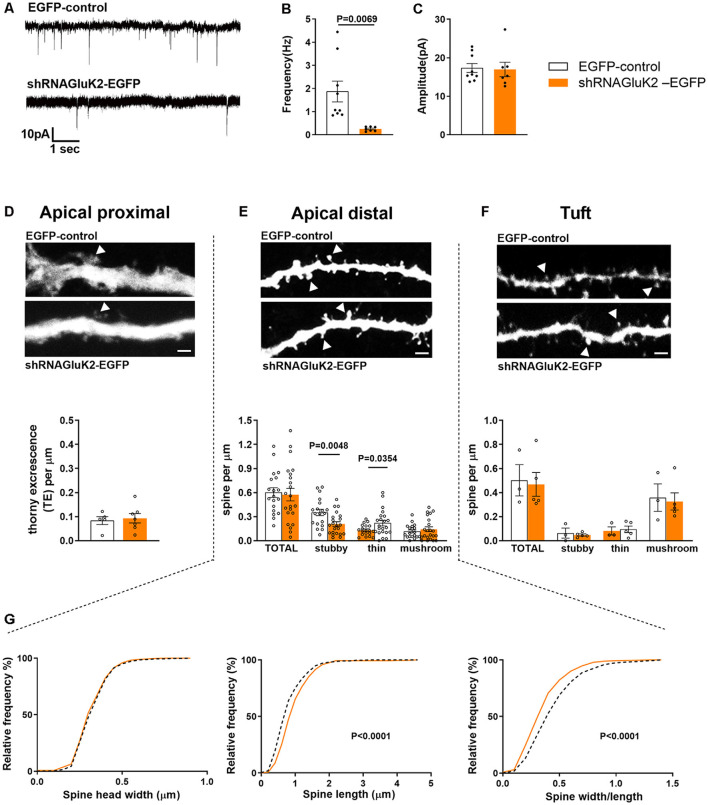
Figure 3.
In vivo GluK2 silencing results in a low frequency of mEPSCs and aberrant spine morphology in CA3 dendritic spines. (A–C) Reduced number of functional synapses in dendrites of shRNAGluK2 expressing neurons. (A) Example traces of mEPSCs from EGFP-control and shRNAGluK2 expressing CA3 pyramidal neurons. Pooled data for the frequency (B) and amplitude (C). Data are presented as mean ± SEM (p < 0.001 considered significant). (D–F upper panel) Example dendritic segments from apical proximal, distal, and tuft regions used for dendritic spine morphology analysis. The upper panel shows GFP-control and lower panel shRNAGluK2 respectively. Calibration bar: 5 μm. (D–F lower panel) Quantification of spine density in apical proximal (thorny excrescence; D), distal (E), and Tuft (F) dendritic segments. Panel (G) shows the frequency distribution of the dendritic spine head width, spine length, and width/length ratio from apical distal dendritic segments. White bar and segmented lines represent data from EGFP-control cells. Orange-colored bars and filled lines represent data from shRNAGluK2 expressing neurons.

