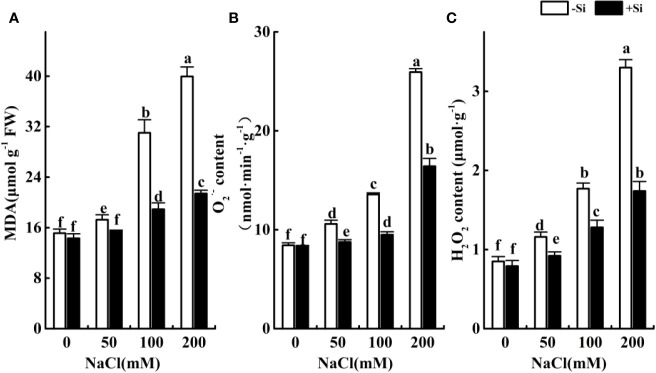
Figure 4.
The effect of salt and Si treatment on MDA (A), O2•− (B) and H2O2 (C) content in alfalfa leaves. Four weeks-old alfalfa seedlings were exposed to 0, 50, 100, and 200 mM NaCl with (+2 mM Si) or without (−2 mM Si) Silicon for 14 d. Leaves were sampled 14 d after initiating salt treatment to determine MDA, O2•− and H2O2 content. Bars indicate standard deviation (SD) of the means (n = 4). Different letters denote significant differences among the treatments based on Duncan’s multiple range test (P < 0.05).

