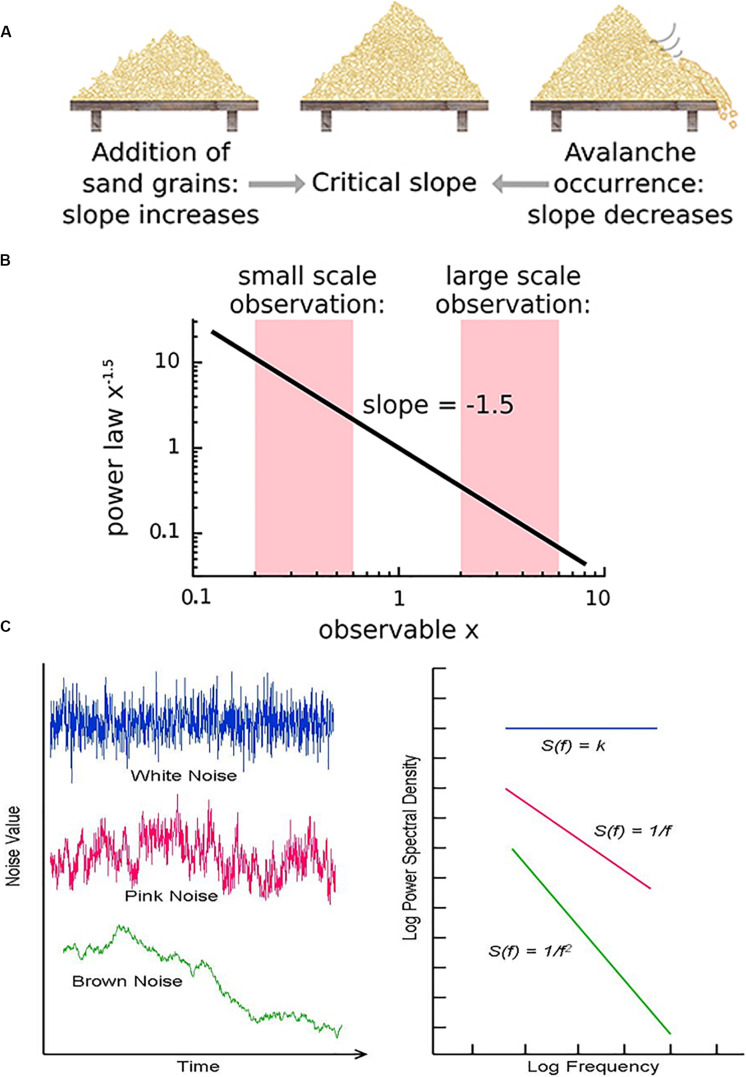
FIGURE 3.
(A) The sandpile model is a classic model of self-organized criticality (SOC), derived as a though experiment (Bak et al., 1988) and proven later with rice piles (Frette et al., 1996). Sand is dropped continuously at a fixed rate onto a flat surface. A sandpile forms. As the sand is added, the slope of the pile increases and avalanches of sand grains begin to occur. If the slope exceeds a “critical slope,” small and large avalanches will decrease the slope back closer to the critical slope. (B) At the critical slope, the distribution of avalanche sizes (i.e., number of sand grains) is power-law distributed. On a log-log plot, the slope of a power-law-distributed variable gives the power-law exponent. Most avalanches are small but a non-negligible number are quite large, up to nearly the size of the entire system. (A,B) reused with permission from Hesse and Gross (2014). (C) Neurophysiologic measurements such as voltage from an EEG recording can be displayed as time series that exhibit characteristic spectral densities S(f). (C) Figure reused with permission from Scholarpedia and E. Izhikevich. Plot of different color-coded time series (left) and a log-log plot of their respective spectral densities (right). In Gaussian “white” noise, each frequency has equal energy, leading to a constant spectral density. “Pink” noise, which is characteristic of SOC but arises in many other settings, has a spectral density given by 1/f, thus the name “1/f noise.” “Brown” noise refers to Brownian or random motion, whose spectral density is typically given by 1/f2.

