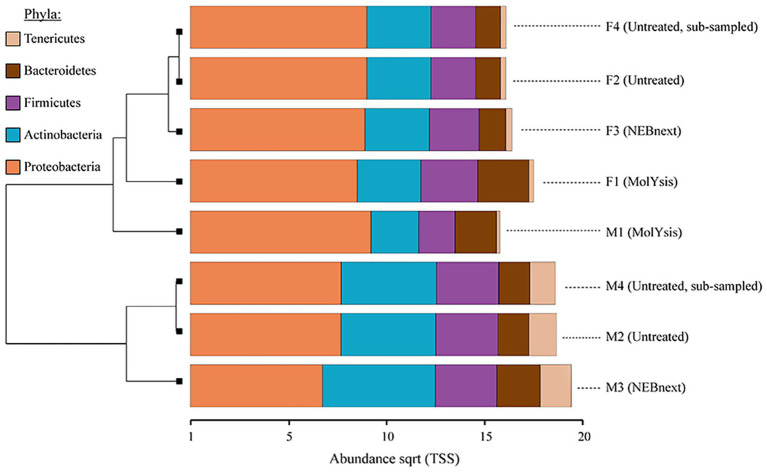
Figure 3.
Clustered bar chart based on hierarchical clustering of the Bray-Curtis distances of milk and filter aliquots visualized in Calypso after total sum scaling (TSS) normalization. The most common bacterial phyla obtained from different sample type, sequencing depth, and microbiome DNA enrichment methods are shown. The horizontal axis is the square root abundances of the identified taxa.

