Figure 1.
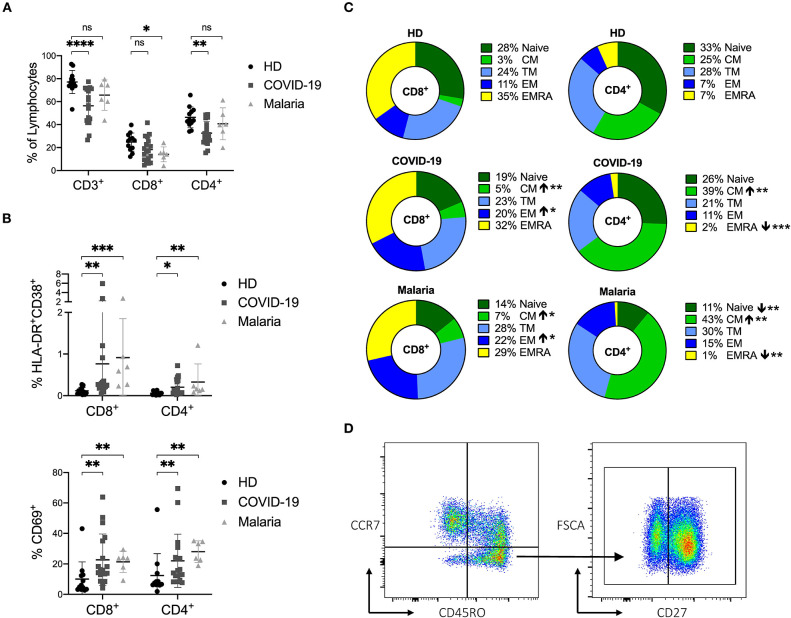
(A–D) Frequency of CD3+ T cells and distribution of naïve and memory subsets as well as the activation status of T cells in COVID-19 and malaria patients compared to healthy donors. (A) Frequency of CD3+, CD8+, and CD4+ T cells in healthy donors (HD) and COVID-19 and malaria patients. (B) Frequency of CD69+, HLA-DR+CD38+ CD8+, and CD4+ T cells in healthy donors and COVID-19 and malaria patients. (C) T cell distribution illustrated in donut charts showing the mean frequency of naive (CCR7+/CD45RO−), central memory CM (CCR7+/CD45RO−), transitional memory TM (CCR7−/CD45RO+/CD27+), effector memory EM (CCR7−/CD45RO+/CD27−), and terminal effector memory EMRA (CCR7−/CD45RO−) CD8+, and CD4+ T cells in healthy donors and COVID-19 and malaria patients. Frequencies in COVID-19 and malaria patients were compared with HD. (D) Representative dot plots of PBMC gated on either CD8+ or CD4+ T cells for T cell distribution. P-values were calculated by Mann–Whitney test. P-values smaller than 0.05 were considered significant, where *, **, ***, and **** indicate p-values between 0.01 to 0.05, 0.001 to 0.01, 0.0001 to 0.001 and <0.0001 respectively.

