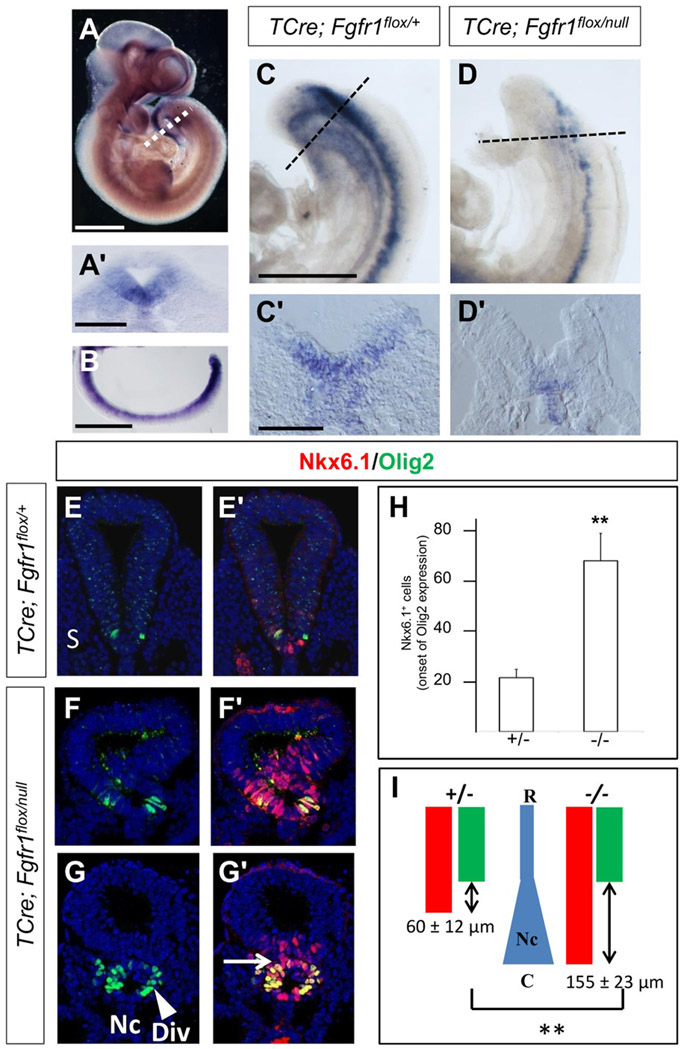
Figure 6.
FGF signaling is required for the onset of mouse Ptch2 expression and for the initial ventral patterning of the neural tube in mouse embryos. (A, A′, B) Expression of Ptch2 in stage E10.5 (A, A′) and E9.5 (B) mouse embryos in whole mount (A), in a transverse section (A′) at the level of the dotted line in (A) and in a dissected caudal neural tube (B). (C–C′, D–D′) Expression of Ptch2 in E9.5 TCre; Fgfr1flox/+ (C–C′) or in TCre; Fgfr1flox/null (D–D′) mouse embryos in whole mount (C, D) and in transverse sections (C′, D′). (E–E′, F–F′, G–G′) Transverse sections of E10.5 stage spinal cord of the indicated genotypes, showing the expression of Olig2 and Nkx6.1 at caudal levels. (E–E′, F–F′) Sections corresponding to the region where the first Olig2 expressing cells appear in a TCre; Fgfr1flox/+ embryo or in a TCre; Fgfr1flox/null embryo. (G–G′) Section showing the abnormal morphology of the neural tube of a TCre; Fgfr1flox/null embryo. (H) Quantification of the number of Nkx6.1+ cells at the spinal cord levels where the first Olig2 expressing cells appear in control and TCre; Fgfr1flox/null embryos. Each bar represents mean±SEM. (I) Diagram depicting the domains of Olig2 and Nkx6.1 along the rostral (R) to caudal (C) axis in TCre; Fgfr1flox/+ and TCre; Fgfr1flox/null embryos. The rostrocaudal distance separating the initiation of Olig2 and Nkx6.1 expression is shown with a double arrowed symbol and mean±SEM are indicated. The changing shape of the notochord is also depicted in blue. Nc: Notochord, S: somite, Div: diverticulum, arrow points at the separation of the tube and the diverticulum, R: Rostral, C: Caudal. Scale bars: 500 μm (A), 100 μm (A′), 500 μm (B), 500 μm (C for C and D), 100 μm (C′ for C′ and D′). ** p ≤ 0,01 (Student’s t test).

