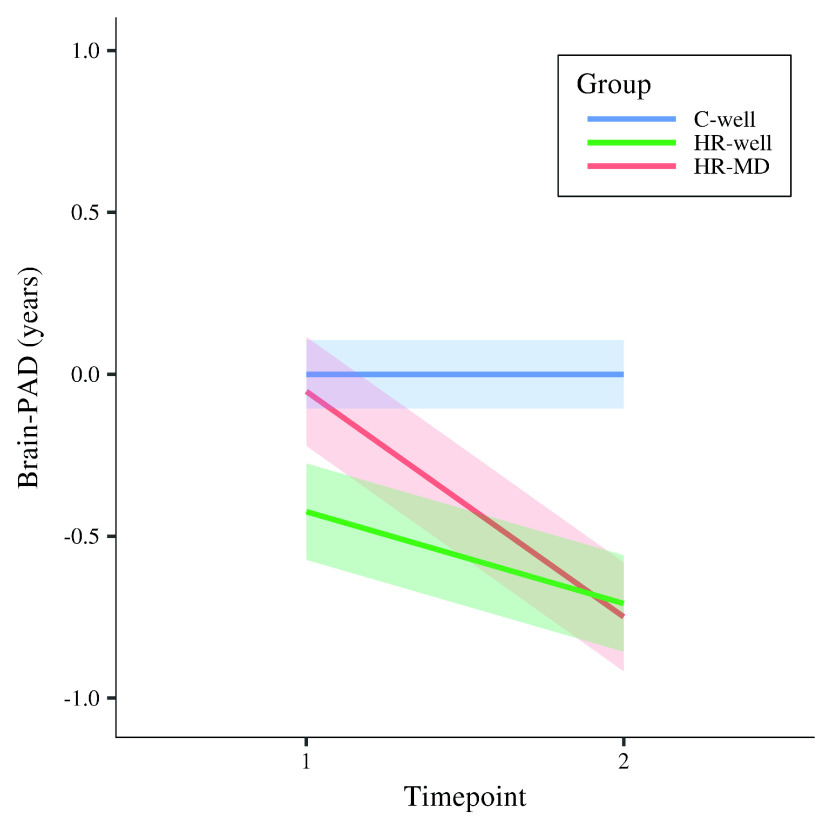
Figure 1. Modelled fixed effects of the brain-predicted age difference (brain-PAD) per group, for clarity corrected for effects in C-well (i.e., the intercept and timepoint coefficients) as this group functions as control group.
Shaded areas display standard errors of the timepoint by group interaction effects. Brain-PAD, brain-predicted age difference; C-well, group of participants without family history who remained well; HR-MD, group of participants at high familial risk who developed a mood disorder; HR-well, group of participants at high familial risk who remained well.

