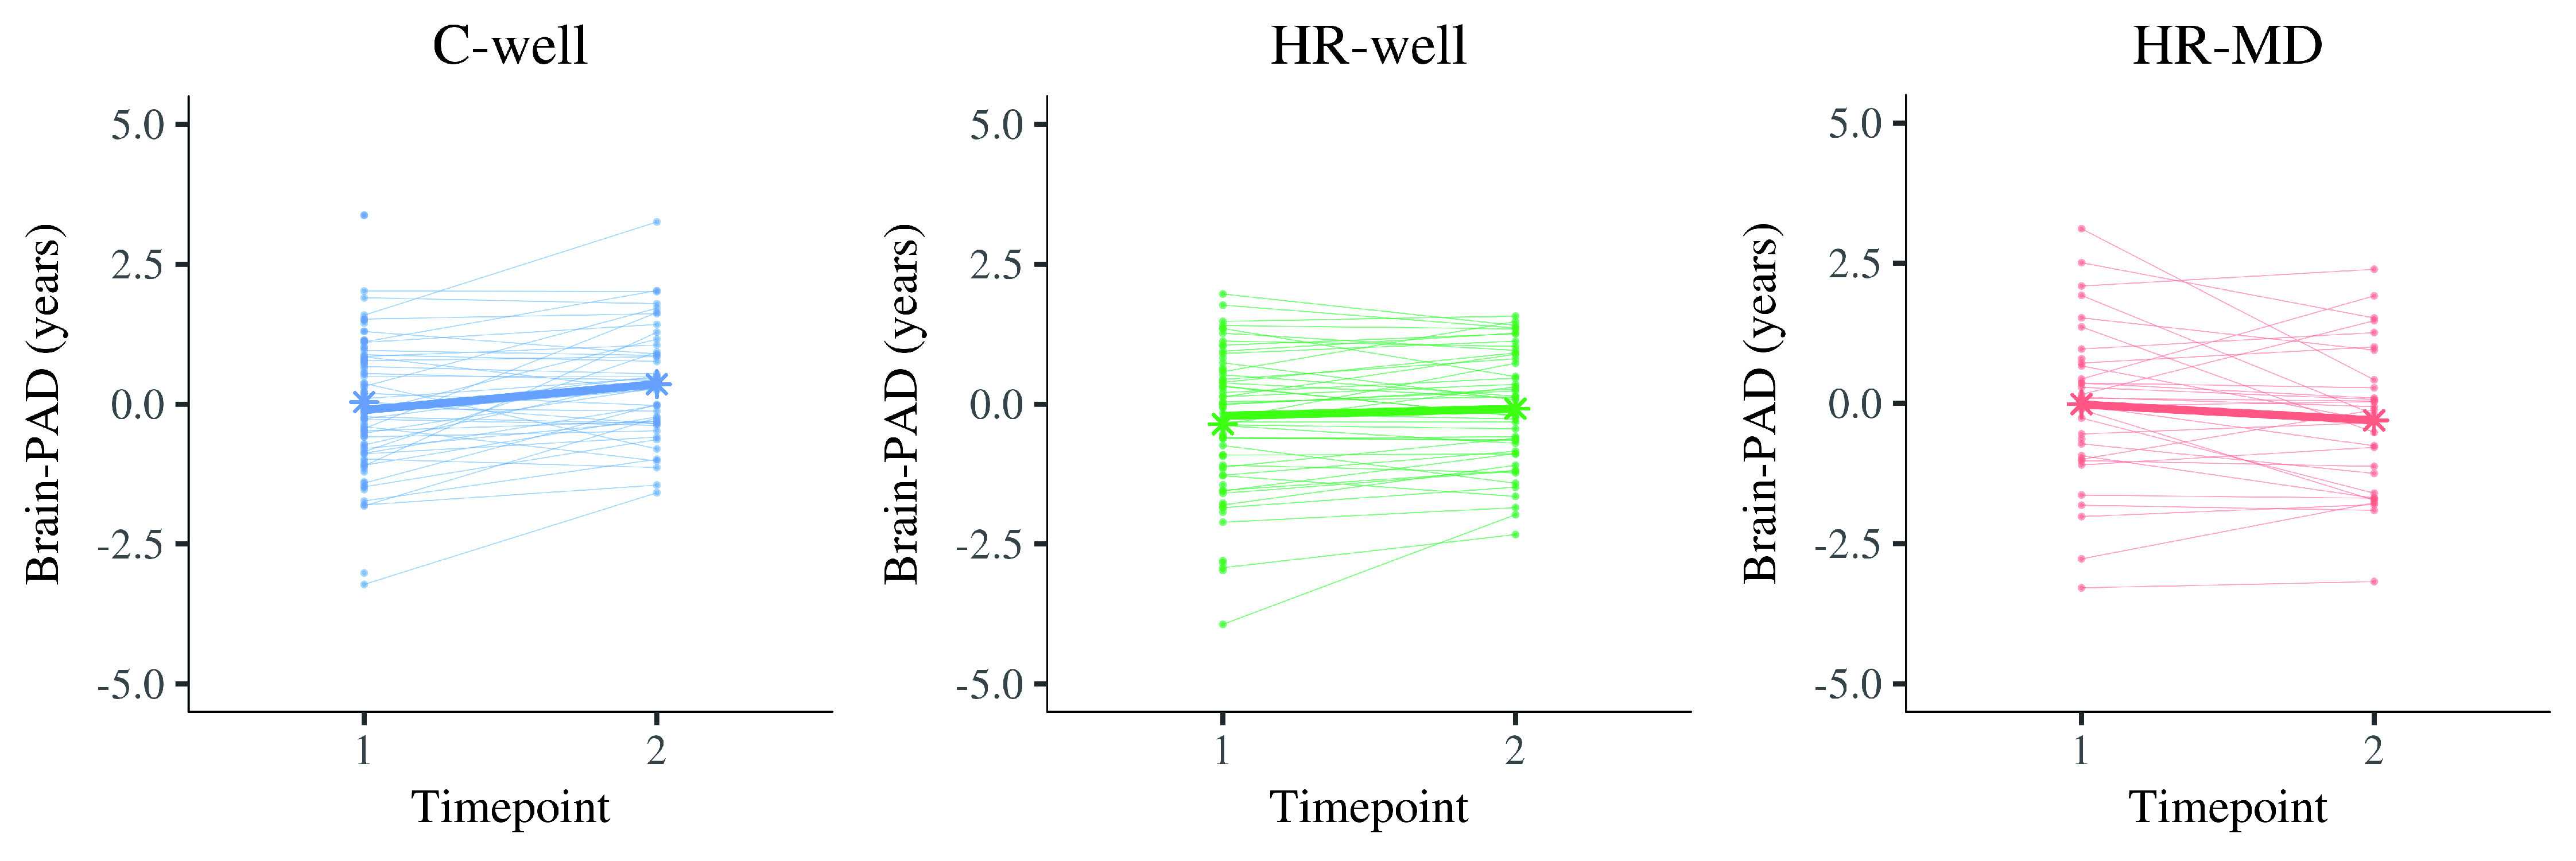
Figure 2. Display of brain structure ageing trajectories per participant, reflecting a changing brain-predicted age difference (brain-PAD) between timepoint 1 and timepoint 2 (two years apart).

Each panel contains the trajectories of one group in thin line graphs, whereas the thicker line graph represents the average trajectory of that group (of complete cases). The star dots display the mean brain-PAD at each timepoint. Left panel, C-well; Middle panel, HR-well; Right panel, HR-MD. Brain-PAD, brain-predicted age difference; C-well, group of participants without family history who remained well; HR-MD, group of participants at high familial risk who developed a mood disorder; HR-well, group of participants at high familial risk who remained well.
