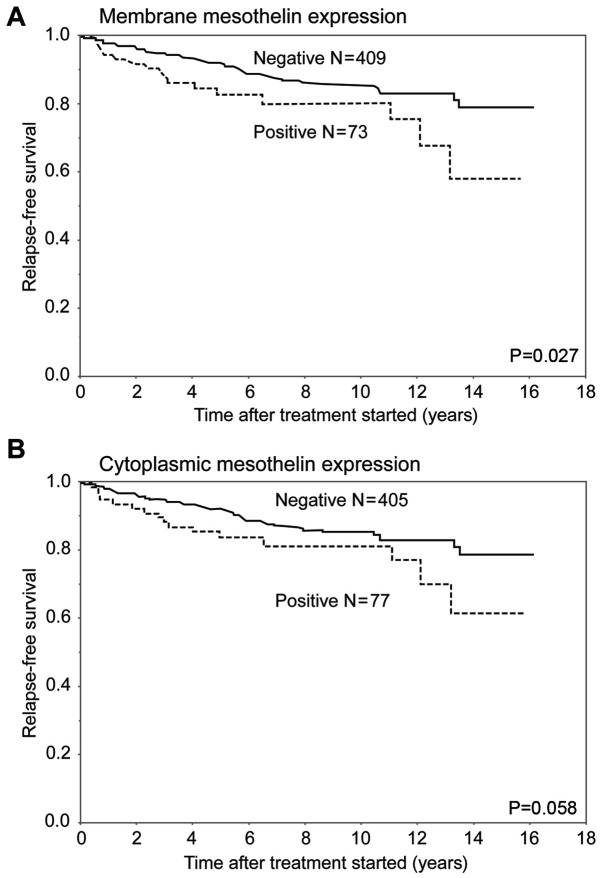
Figure 3.
RFS curves for patients with breast cancer after surgical therapy, stratified by mesothelin expression status. (A) Curves for membrane mesothelin expression-positive and -negative groups, and (B) curves for cytoplasmic mesothelin expression-positive and -negative groups. The membrane expression-positive group had a less favorable outcome than the membrane expression-negative group (P=0.027). However, cytoplasmic mesothelin expression was not significantly associated with RFS (P=0.058). RFS, relapse-free survival.

