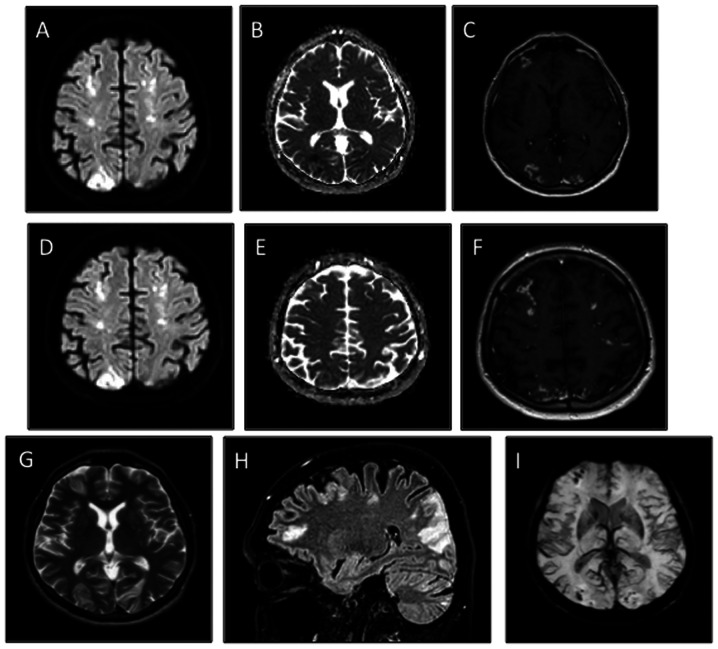
Figure 2.
Baseline brain MRI. (A-C) Multiple patchy foci of diffusion restriction in the grey matter of the occipital lobes, consistent with acute cerebral infarcts. The multiple patchy foci affected not only the distal territories of the both posterior cerebral arteries but also innumerable tiny foci restricted diffusion in the deep cerebral white matter. (D-F) Star field pattern characteristic of cerebral embolism syndrome. (C and F) Moderate patchy and gyriform enhancement (sign of subacute cerebral infarcts) were evidenced after gadolinium administration. (A and D) Diffusion weighted imaging. (B and E) Apparent diffusion coefficient maps. (C and F) T1-w post gadolinium administration images. (G and H) Overview of the multiple ischemic infarcts as (G) FSE and (H) FLAIR hyperintensities in T2-w images. (I) Susceptibility weighted imaging showed several tiny blooming hypointense foci throughout the hemispheric grey and white matters, characteristic of microbleeds secondary to cerebral embolism syndrome.

