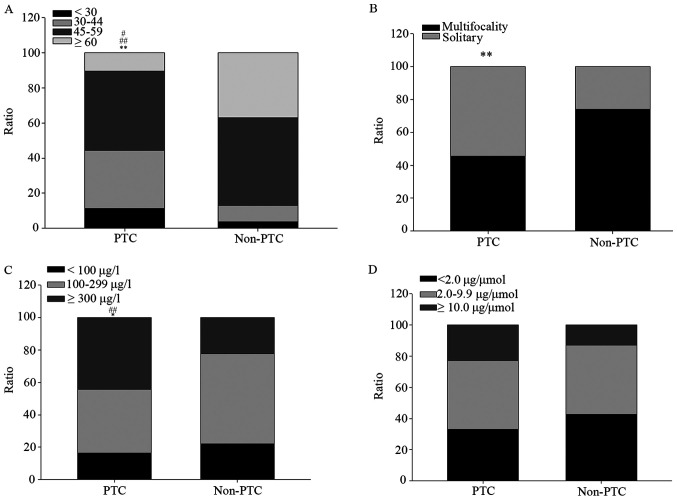
Figure 1.
Distribution of basic characteristics between PTC and non-PTC among patients with thyroid nodules. (A) Age distribution. #P<0.05 vs. non-PTC group for <30 age range. ##P<0.01 vs. non-PTC group for ≥60 age range. (B) Multifocality of nodule distribution. (C) UIC distribution. ##P<0.01 vs. non-PTC group for ≥300 µg/l. (D) UIC/creatinine distribution. *P<0.05 and **P<0.01 vs. non-PTC group. PTC, papillary thyroid carcinoma; UIC, urinary iodine concentration.

