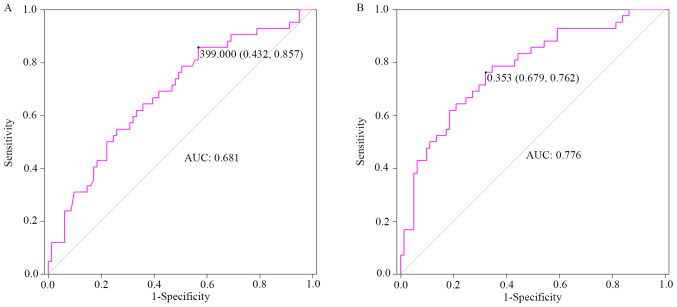
Figure 2.
Diagnostic value of high urinary iodine concentration for papillary thyroid carcinoma risk in patients with thyroid nodules. (A) ROC curve by univariate analysis. (B) ROC curve by multivariate analysis following adjustment for potential covariates, including sex, age, smoking habits and body mass index. ROC, receiver operating characteristic; AUC, area under the ROC curve.

