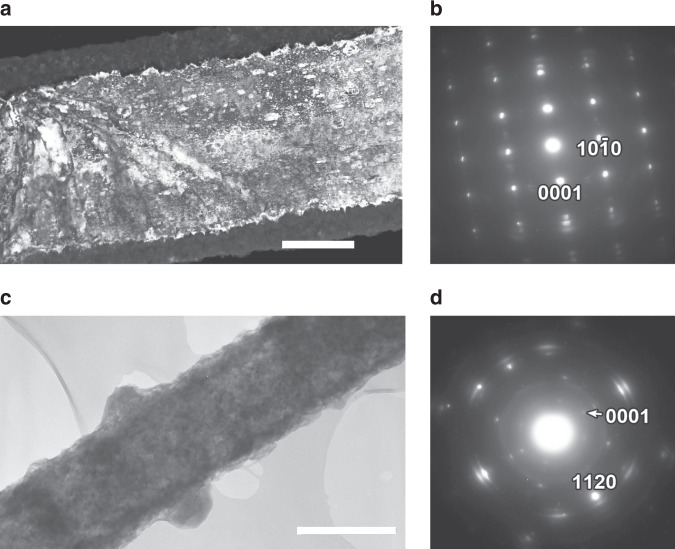
Fig. 2. Transmission electron microscopic (TEM) images and selected area electron diffraction (SAED) patterns of type I and type II fibres.
a High-magnification dark-field TEM image of a type I fibre (Li3N core and an LiOH outer layer) and b corresponding SAED pattern in the <20> projection demonstrating the <100> nanofibre growth direction; c bright-field TEM image of a type II fibre and d corresponding SAED pattern in the <010> projection (with arcs due to an LiOH surface layer) showing the <0001> growth direction. Scale bars in a and c correspond to 500 nm.

