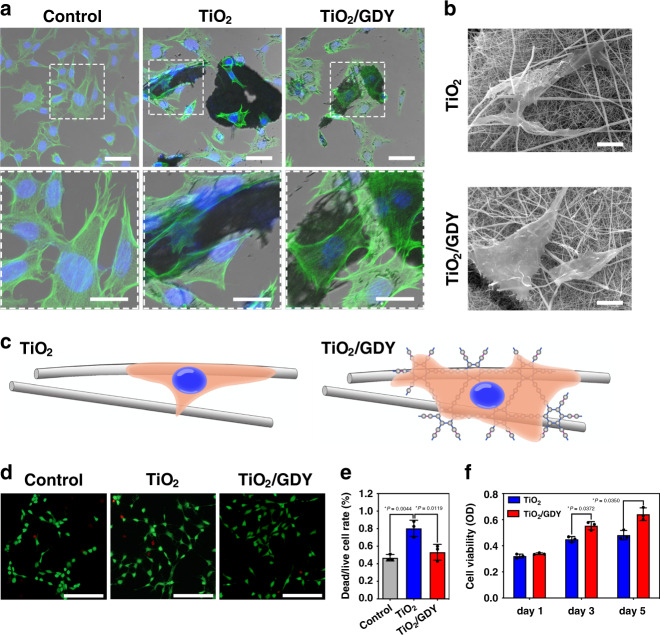
Fig. 2. Cell morphology and viability of TiO2/GDY and TiO2.
a Cytoskeleton staining of MC3T3-E1 cells with FITC-tagged phalloidin (green) and DAPI (blue) after co-culturing with TiO2 or TiO2/GDY nanofibers for 24 h; scale bar = 50 μm (above); 25 μm (below) (n = 3 independent experiments). b SEM images showing the MC3T3-E1 cell morphology on nanofibers (scale bar = 10 μm).(n = 3 independent experiments). c Illustration of the states of cell adhesion on different nanofibers. d Live/dead staining with calcein AM (green) for live cells and PI (red) for dead and apoptotic MC3T3-E1 cells cultured with nanofibers (scale bar = 50 μm). e Ratio of PI- and calcein AM-stained positive cells quantitated from the live/dead stain. (n = 3). f Cell proliferation assay for MC3T3-E1 cells cultured with TiO2 or TiO2/GDY nanofibers for 1, 3, and 5 days. The data of e, f are shown as the mean ± S. D., error bars = Standard Deviation (n = 3 independent experiments, one-way ANOVA was applied for statistical analysis, *p < 0.05; **p < 0.01). Source data of e, f are provided as a Source Data file.

