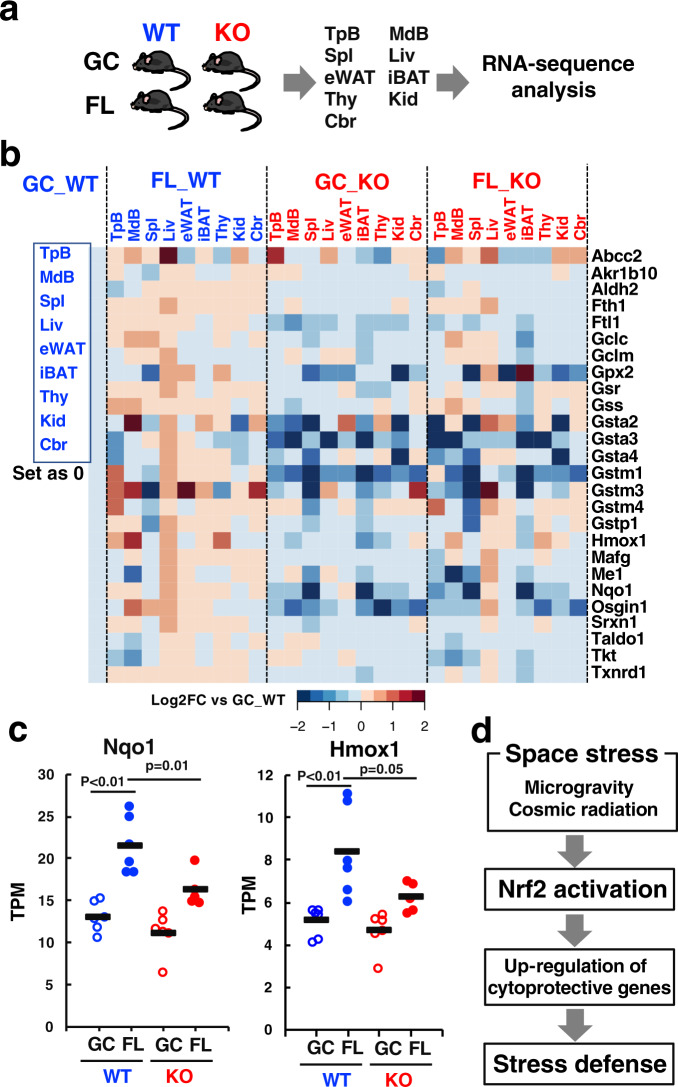
Fig. 2. Space stresses activate the Nrf2 pathway.
a RNA-sequence analyses of tissues from WT and Nrf2-KO mice in GC and FL groups. b Heatmap of expression levels of representative Nrf2-target genes in temporal bone (TpB), mandible bone (MdB), spleen (Spl), liver (Liv), epididymal white adipose tissue (eWAT), inter-scapular brown adipose tissue (iBAT), thymus (Thy), kidney (Kid), and brain cerebrum (Cbr) from WT and Nrf2-KO mice in GC and FL groups. c Expression levels of Nqo1 and Hmox1 genes in thymus from WT and Nrf2-KO mice in GC and FL groups. Data are presented as mean, and dots represent individual animals. n = 6 for GC_WT, FL_WT and GC_KO, and n = 5 for FL_KO, one-way ANOVA with Tukey–Kramer test. d Model for space stress response system by Nrf2 signaling.

