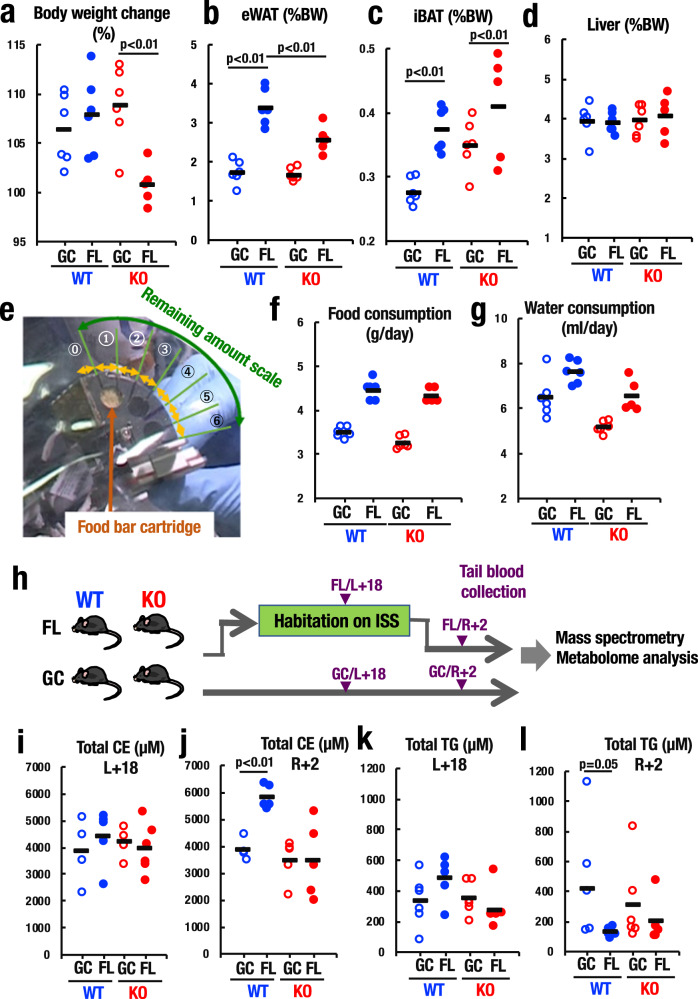
Fig. 5. Nrf2 deficiency affects body weight gain and abdominal white adipose tissue.
a Body weight change of WT and Nrf2-KO mice from before launch to after flight in GC and FL groups. Note that Nrf2-KO mice failed to gain body weight during space flight unlike WT mice. n = 6 for GC_WT, FL_WT and GC_KO, and n = 5 for FL_KO. b–d Body weight-normalized masses of eWAT (b), iBAT (c), and liver (d) from WT and Nrf2-KO mice in GC and FL groups. n = 6 for GC_WT, FL_WT and GC_KO, and n = 5 for FL_KO. Note that eWAT increased significantly in WT mice during space flight, but the increase was smaller in Nrf2-KO mice. e Food intake was estimated by remaining food scale of food bar cartridge. f, g Food intake (f) and water consumption (g) of WT and Nrf2-KO mice in GC and FL groups. n = 6 for GC_WT, FL_WT and GC_KO, and n = 5 for FL_KO. h Timeline for mass spectrometry-based metabolome analyses of plasma from tail blood of WT and Nrf2-KO mice in GC and FL groups. i–l Plasma levels of total cholesterol ester (CE) (i, j) and total triglyceride (TG) (k, l) and in WT and Nrf2-KO mice in GC and FL groups during flight (L + 18) (i, k) and after return (R + 2) (j, l). Data are presented as mean, and dots represent individual animals. n = 4 (GC_WT), n = 5 (FL_WT), n = 4 (GC_KO), and n = 5 (FL_KO) for (i). n = 5 (GC_WT), n = 5 (FL_WT), n = 5 (GC_KO), and n = 5 (FL_KO) for (j). n = 6 (GC_WT), n = 5 (FL_WT), n = 6 (GC_KO), and n = 5 (FL_KO) for (k). n = 5 (GC_WT), n = 6 (FL_WT), n = 6 (GC_KO), and n = 5 (FL_KO) for (l). One-way ANOVA with Tukey–Kramer test.

