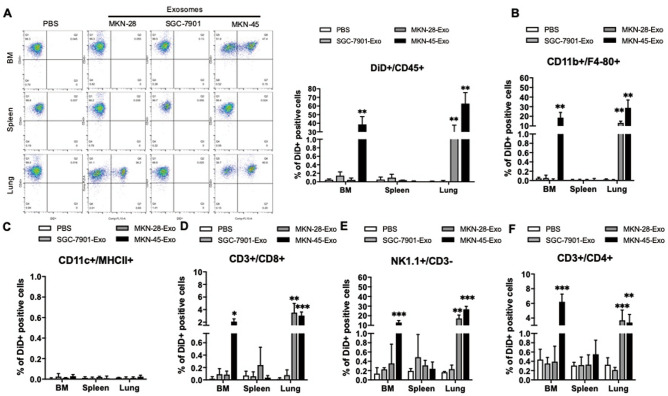
Figure 4.
Uptake of SGC-7901, MKN-45, MKN-28 derived exosomes by immune cell subpopulation. The percentage fluorescent signal of exosome uptake by immune populations in the bone marrow BM, spleen, and lung was analyzed post 48 h by flow cytometry after injection of DiD-labeled SGC-7901, MKN-45, MKN-28-derived exosomes (20 μg/mice) or PBS (control) in C57BL/6 mice. (A) Representative flow cytometric plots (left) and quantification (right) of distinct DiD+ population within CD45+ cells. (B–F), Frequency of the DiD+ subpopulation within macrophages (Mø; CD11b+/F4/80+, B), DCs (CD11C+/MHCII+, C), CD8 T cells (CD3+/CD8+, D), NK cells (NK1.1+/CD3−, E) and CD4 T cells (CD3+/CD4+, F). Results are presented as mean ± SEM and analyzed by ANOVA, *, P < 0.05, **, P < 0.01, ***, P < 0.001.

