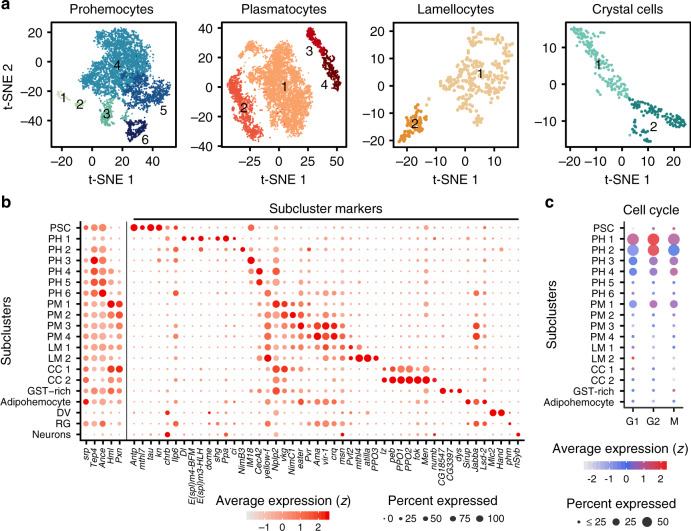
Fig. 2. Subclustering analysis of hemocytes in the lymph gland.
a Subclusters of hemocytes—prohemocytes, plasmatocytes, lamellocyte, and crystal cells—are projected onto two-dimensional t-SNE plots. The numbers in the plots represent the subcluster number. b Dot plot presentation of significant gene sets in the 17 subclusters using Wilcoxon Rank-Sum test. 5 representative markers, srp, Tep4, Ance, Hml, and Pxn are indicated to the left column. Signature genes identified in this study are marked with subcluster markers. Dot color shows levels of average expression, and dot size represents the percentage of cells expressing the corresponding marker genes in each subcluster. Non-hematopoietic cell types are indicated (DV, dorsal vessel; RG, ring gland; Neurons). Cell count for each subcluster is listed in Supplementary Table 4. c Expressions of cell-cycle regulating genes in 17 subclusters. Dot color indicates average expression levels and dot size displays the percentage of cells with cell cycle controlling genes (Cdk1, CycD, and CycE for G1; stg, CycA, and CycB for G2; polo, aurB, and Det for M) in each subcluster.

