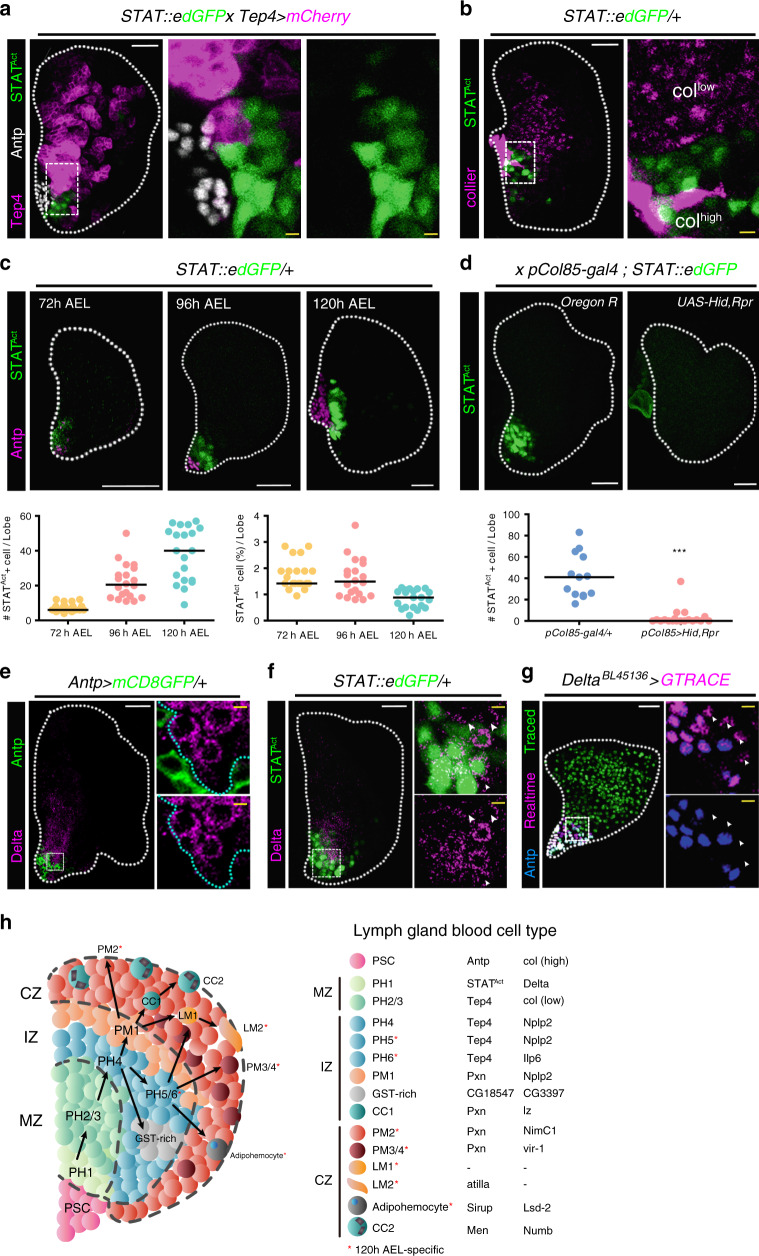
Fig. 5. Expression of PH1 in the lymph gland.
a STAT92EAct (green) and Tep4+ (magenta) or Antp+ (white) cells are mutually exclusive (Tep4-gal4 UAS-mCherry; STAT92E::edGFP). Magnified images: STAT92EAct and Tep4+ cells near Antp+ PSC. b STAT92EAct (green) do not co-localize with cells expressing high (PSC) or low (PHs) levels of collier (magenta). Magnified images: STAT92EAct and col+ cells near the PSC. c. The number of STAT92EAct cells (green) increases during lymph gland development (72 (n = 24), 96 (n = 17), and 120 h (n = 20) AEL). Antp+ (magenta) and STAT92EAct are separable at all timepoints. Graphs represent quantitation of the number (left) or the proportion (right) of STAT92EAct cells in one lymph gland lobe. d. Genetic ablation of the PSC (pCol85-gal4; STAT92E::edGFP UAS-Hid, Rpr) attenuates STAT92EAct (green) expression (top). Graph indicates quantitations of the number of STAT92EAct cells in one lymph gland lobe (bottom, Mann–Whitney test, ***P < 0.0001). pCol85-gal4/+ (n = 13) or pCol85-gal4 UAS-Hid, Rpr (n = 19). e Dl+ cells (magenta) are localized adjacent to the PSC (Antp, green). Magnified images: Dl+ and Antp+ cells. Cyan dotted lines demarcate Dl+ cells. f Dl+ cells (magenta) co-localize with STAT92EAct (green). Magnified view: Dl+ and STAT92EAct cells (right). A few Dl+ cells that do not express STAT92E::edGFP are indicated (arrowhead). g Lineage tracing of Dl+ cells (green, traced; magenta, real-time; blue, Antp). DeltaBL45136-gal4 UAS-GTRACE covers the entire lymph gland. Arrowheads represent Dl+ cells next to the Antp+ Dl+ PSC. h Model of the lymph gland hematopoiesis. PH1 cells are adjacent to the PSC. PH1 and PSC or PH2 are mutually exclusive. There are multiple states of prohemocytes including GST-rich and intermediary PHs/PMs. Plasmatocytes represent a heterogeneous cell population including adipohemocytes and late plasmatocytes, PM3-4. Colors indicate subclusters. Putative subclusters in the medullary zone (MZ), the cortical zone (CZ), or the intermediate zone (IZ) are described (right). Subcluster-specific markers verified in this study are listed (right). Red asterisks indicate 120 h AEL-specific subclusters. White scale bar, 30 μm; yellow scale bar, 3 μm. White dotted line demarcates the lymph gland. The dotted box (a–b, e–g) indicates a magnified region. Each panel at the right displays magnified views. Median value is represented in graphs (c, d).

