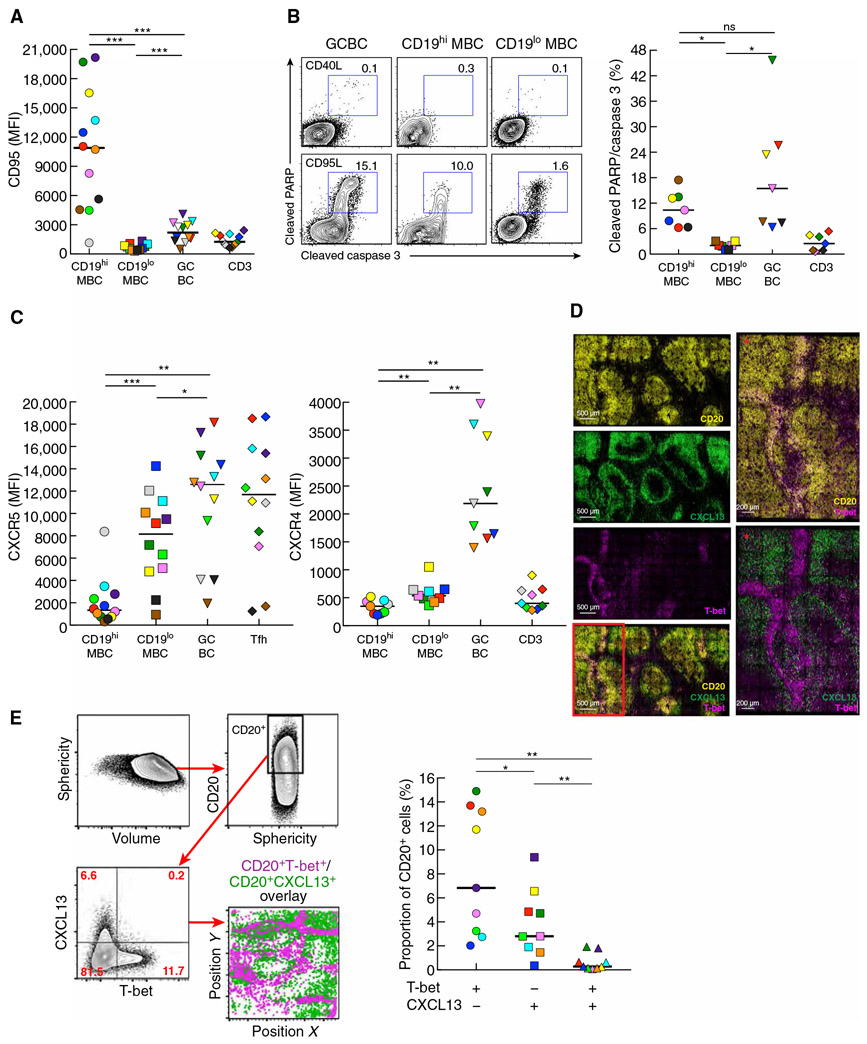
Fig. 4. Profile of T-bet+ MBC in LN of HIV-infected individuals similar to GCBC but consistent with non-GC location.
(A) Expression of CD95 evaluated by conventional flow cytometry performed on LN mononuclear cells isolated from HIV-infected individuals (n = 12). (B) Apoptosis depicted and quantified by conventional flow cytometry performed on LN mononuclear cells isolated from HIV-infected individuals (n = 7), after incubation for 30 min with CD95L or CD40L (control). (C) Expression of CXCR5 and CXCR4 evaluated by conventional flow cytometry performed on LN mononuclear cells isolated from HIV-infected individuals (n = 9 to 12). (D) Images obtained by confocal microscopy depicting expression patterns of CD20, CXCL13, and T-bet in an LN section from an HIV-infected individual. Red asterisks are enlarged images from the red boxed inset illustrating distinct areas of expression for T-bet+ and CXCL13+ cells. (E) Imaged data from (D) were converted to flow data with gating scheme shown for delineation of CD20+ cells and depiction of CXCL13 by T-bet expression in CD20+ cells in dot plot and location. Quantification of frequencies of single or double CXCL13 and T-bet expression performed by histo-cytometry on LN sections from HIV-infected individuals (n = 9). In (A) to (C) and (E), each individual is color-coded per Table 1, and black horizontal bars represent medians. *P < 0.05, **P < 0.01, ***P < 0.001 by Wilcoxon matched-pairs signed rank test after obtaining significance by Friedman ANOVA test on B cell subpopulations.

