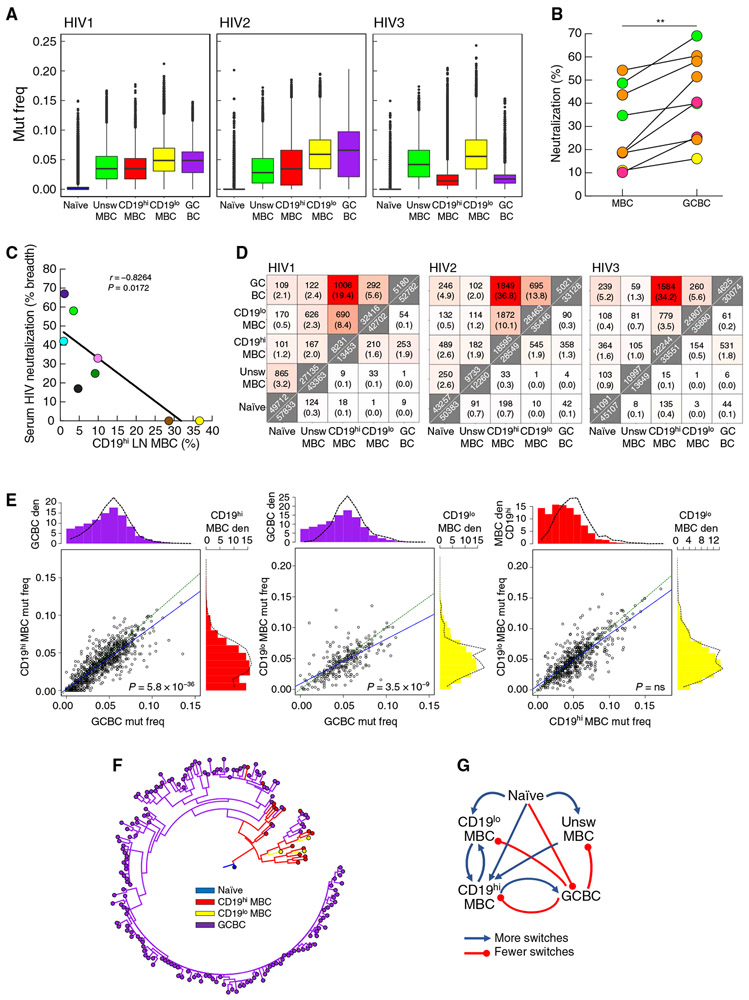
Fig. 6. BCR of CD19hi MBC related to GCBC but with decreased mutation frequency and neutralization capacity.
(A) Determination of IGHV mutation frequencies (mut freq) among B cell populations sorted from LN of three HIV-infected individuals (described in Table 1). Data are presented as box-and-whiskers plots showing the two inner quartiles (boxes) with median (black lines), 1.5 times the inner quartile range (whiskers) and outliers (black circles). (B) HIV pseudotype neutralization by clonally related or epitope target-related mAbs reconstituted from HIV-specific MBC and GCBC of four HIV-infected individuals (related clones/targets are color-coded by individual per table S1). Each value is % neutralization of one clone or median neutralization of 2 to 11 related clones from each source. **P < 0.01 by Wilcoxon matched-pairs signed rank test. (C) Breadth of serologic HIV pseudotype neutralization activity correlated with frequency of CD19hi LN MBC from HIV-infected individuals (n = 9, each individual is color-coded per Table 1). (D) Heatmaps indicating the numbers of shared clonal families (top triangle) and sequences (bottom triangle) from three HIV-infected individuals (identified in Table 1). Along the diagonal are total numbers of clones (top) or unique sequences (bottom). Percentages shown in parentheses were calculated by dividing the number of shared clones or unique sequences by the total in the smaller of the two samples. (E) Scatter-plots show the median IGHV mutation frequency of the two indicated populations for each shared clone from HIV-infected participant HIV1 (Table 1). Green equivalence and blue linear regression lines are depicted. The density (den) histograms show the mutation frequency of all sequences (bars) or sequences within shared clones between the two populations (dashed lines). P values by Wilcoxon signed rank test followed by Bonferroni correction. (F) Example of a multipopulation lineage tree with predicted internal node types. (G) Summary of predicted switches within lineage trees. Blue lines indicate more observed than expected switches; red lines indicate fewer observed than expected switches.

