
Figure 3. Distinct effects of exercise timing on circadian phase of skeletal muscle explants.
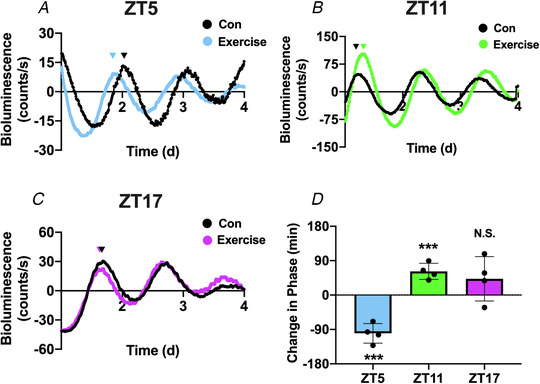
A, bioluminescent tracing (baseline subtracted) of PER2::LUC activity in explanted EDL muscles after 1 h of no‐exercise control (black) or treadmill exercise (blue) at ZT5. B, bioluminescent tracing (baseline subtracted) of PER2::LUC activity in explanted EDL muscles after 1 h of no‐exercise control (black) or treadmill exercise (green) at ZT11. C, bioluminescent tracing (baseline subtracted) of PER2::LUC activity in explanted EDL muscles after 1 h of no‐exercise control (black) or treadmill exercise (purple) at ZT17. D, quantification of the exercise‐induced change in circadian phase (minutes). A decrease in phase indicates a phase advance, and an increase in circadian phase represents a phase delay. Absolute change in phase was compared between exercise and control using an unpaired t test. Triangles above the bioluminescence plots represent the relative peak of circadian phase. ***denotes P < 0.001 compared with control. N.S. denotes no significant change in phase. ZT5: P = 0.0002; ZT11: P = 0.0003; and ZT17: P = 0.1393. [Color figure can be viewed at wileyonlinelibrary.com]