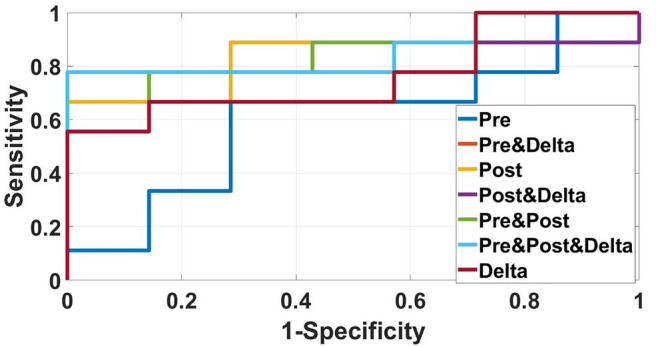
Figure 2.

ROC curves of the radiomics model based on several CT images' features in the validation sample for predicting response to immunotherapy were showed in this figure. The best AUC (0.857) was performed by the radiomics model based on pre-treatment, post-treatment, and delta features.
