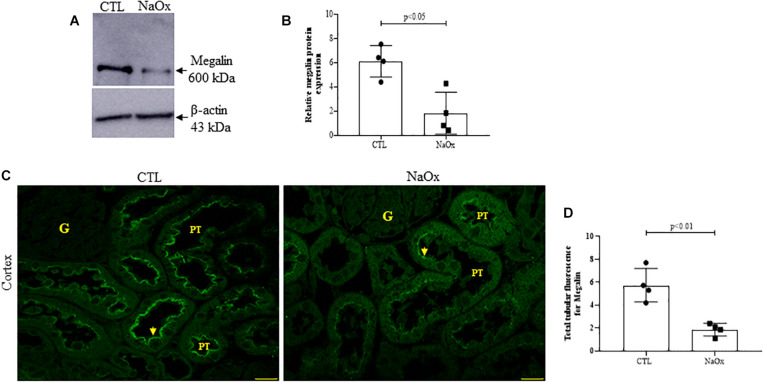
FIGURE 4.
Effect of NaOx treatment on total megalin protein expression. (A,B) Immunoblot analysis was performed on 50-μg protein aliquots resolved by 4% SDS-PAGE. The values are presented as the mean ± SE (n = 4/group) and β-actin was used as an internal control. Megalin staining in the proximal tubule (PT) (C) is indicated by the arrows. Images of megalin immunofluorescence were captured using a Zeiss LSM 510 confocal microscope equipped with a 63× objective. Statistical analysis of megalin immunofluorescence in both the control and treated groups was performed (D). CTL, control; NaOx, sodium oxalate; G, glomerulus. Bar = 50 μm.

