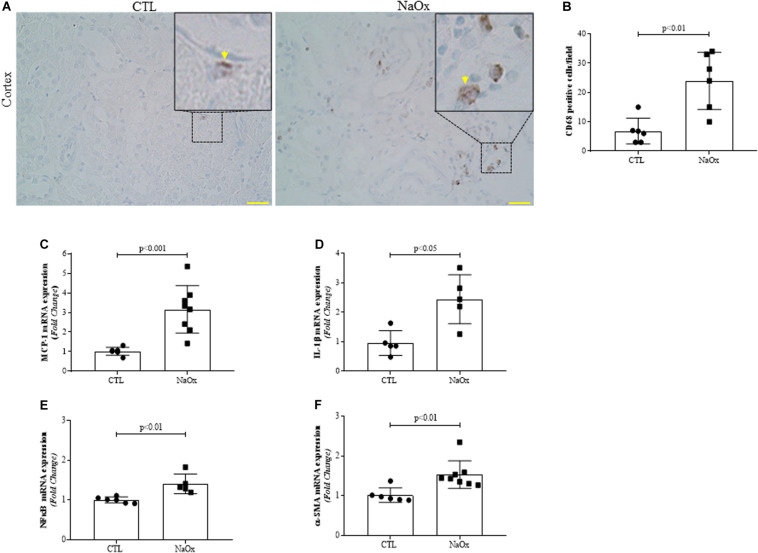
FIGURE 6.
Representative photomicrographs of the renal cortex illustrating tubulointerstitial CD68-positive cells (indicated by arrows) by immunohistochemistry. Images were captured using a morphometric program (NIS-Elements, Nikon) with a 20× objective and magnified images shown at the top were captured with a 40× objective. The values represent the mean ± SE (A,B). Bar = 100 μm. In addition, MCP-1 (C), IL-β1 (D) NFkappaB (E) and α-SMA (F) mRNA expression levels are shown as the mean ± SE (n = 5–8/group). CTL, control; NaOx, sodium oxalate.

