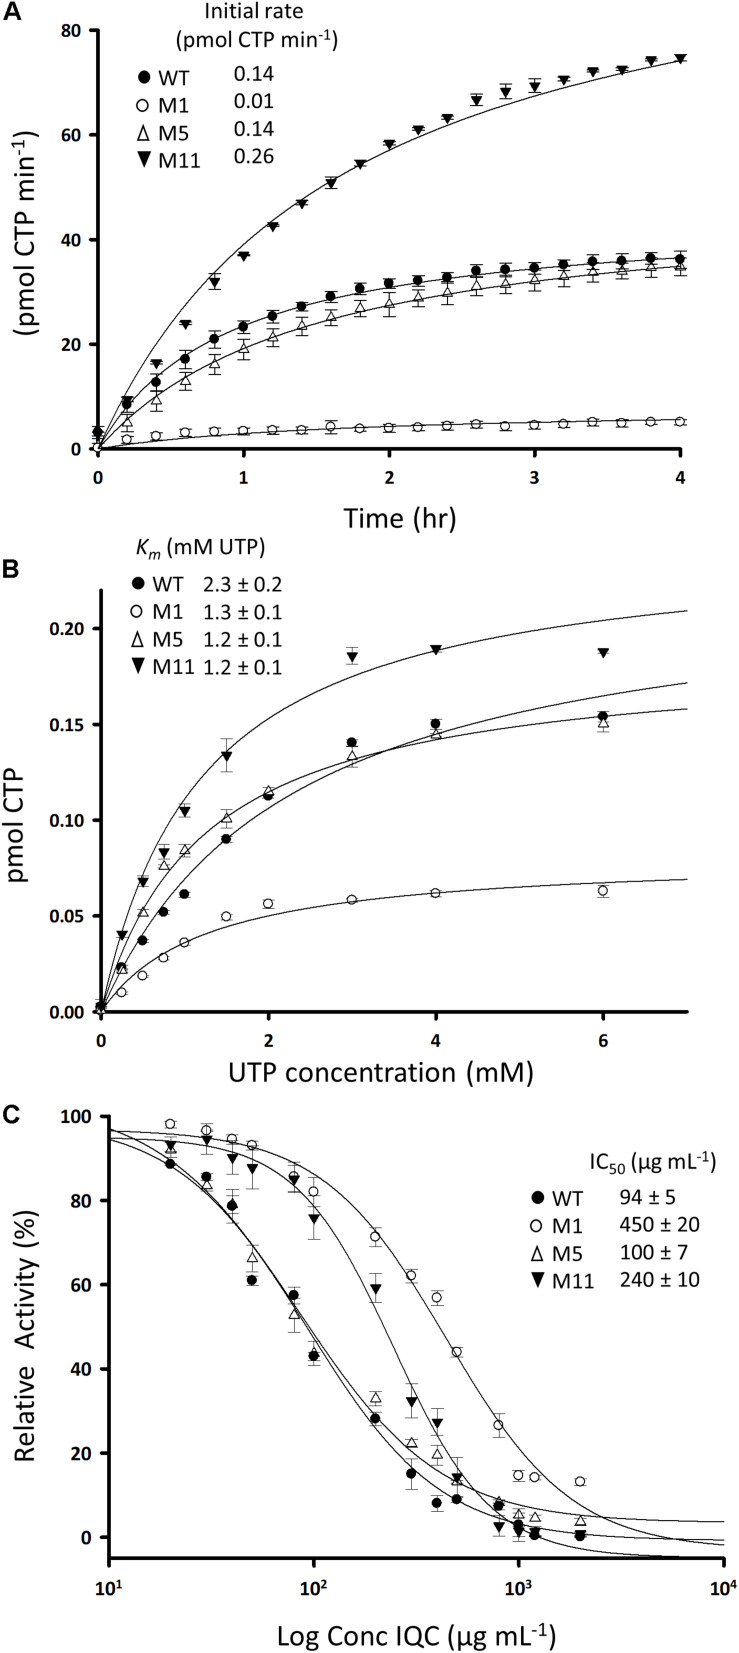
FIGURE 4.
Activities of wild type and mutant CTPS enzymes and the effects of inhibition by IQC. (A) Reaction velocities for the wild type and mutant enzymes. Production of CTP from reactions containing 2 mM UTP was measured by absorbance at 291 nm in the presence of ATP, L-glutamine, and Mg2+. (B) Relationship between UTP concentration and reaction velocity in assays equivalent to (A). Inset shows calculated values for Km. (C) Dose response curves for inhibition of the wild type and mutant enzymes by IQC. Inset shows calculated IC50 values. The reactions were carried out in triplicate and the data points are the mean of three replicates. Errors are ± standard deviation. The fit curves and the IC50 values were calculated using SigmaPlot 13.1.

