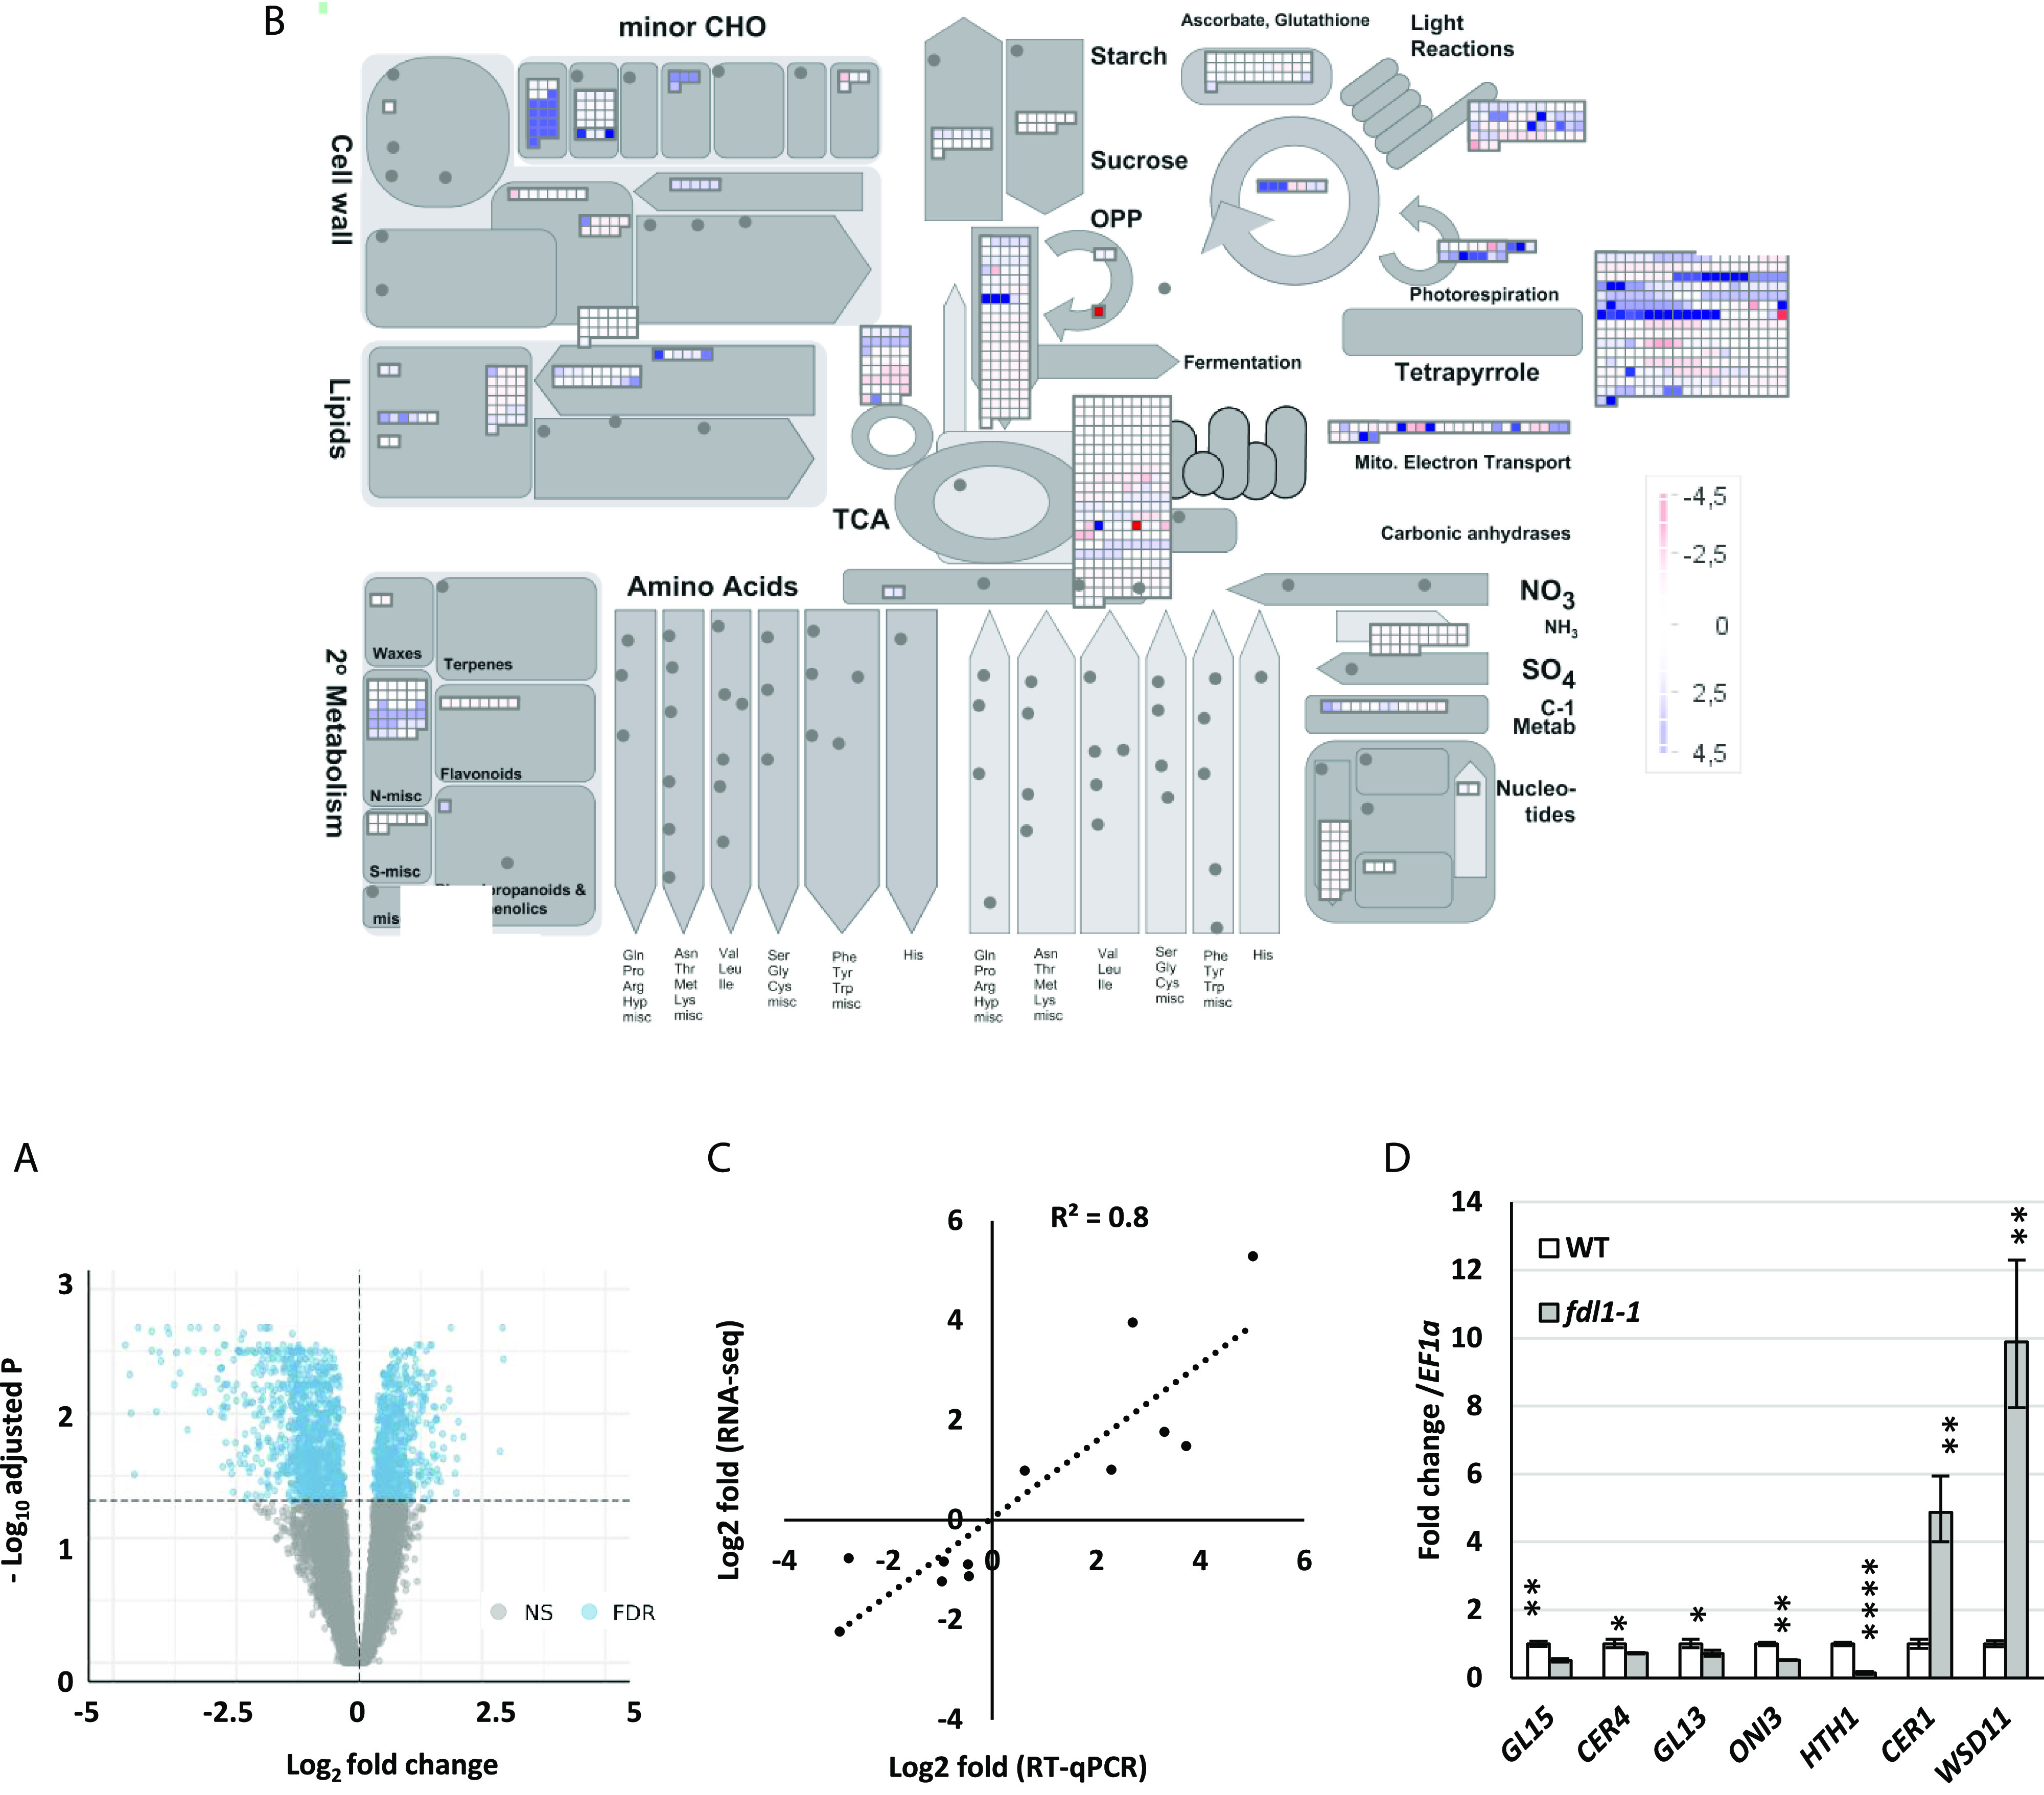
Figure 3.

Functional enrichment of metabolic pathways and cuticle-related genes. A, Volcano plot of DEGs in fdl1-1 compared to wild-type control plants. Blue dots denote upregulated and downregulated DEGs. Gray dots represent genes with no significant P value. B, Functional enrichment of metabolic pathways. The DEGs have been assigned to different cellular components through GO analysis. MapMan was used to provide a general overview of differentially expressed transcripts involved in different metabolic pathways and cellular processes. ZmFDL1/MYB94-mediated changes in different metabolic processes in seedlings are illustrated, with blue indicating induced genes and red repressed genes. C, RT-qPCR validation of DEGs characterized by RNA-Seq. Correlation of log2 fold change data obtained using RT-qPCR (y axis) and with RNA-Seq analysis (x axis). D, Gene expression level of putative cuticle-related genes, analyzed by RT-qPCR, in fdl1-1 and wild-type control seedlings at the coleoptile developmental stage. Values represent the mean fold change variations ± sd of four biological replicates. Comparison is made between wild-type and homozygous fdl1-1 genotypes. Significant difference was assessed by Student’s t test (*P < 0.05; **P < 0.01; and ****P < 0.0001; ns, not significant).
