Figure 6.

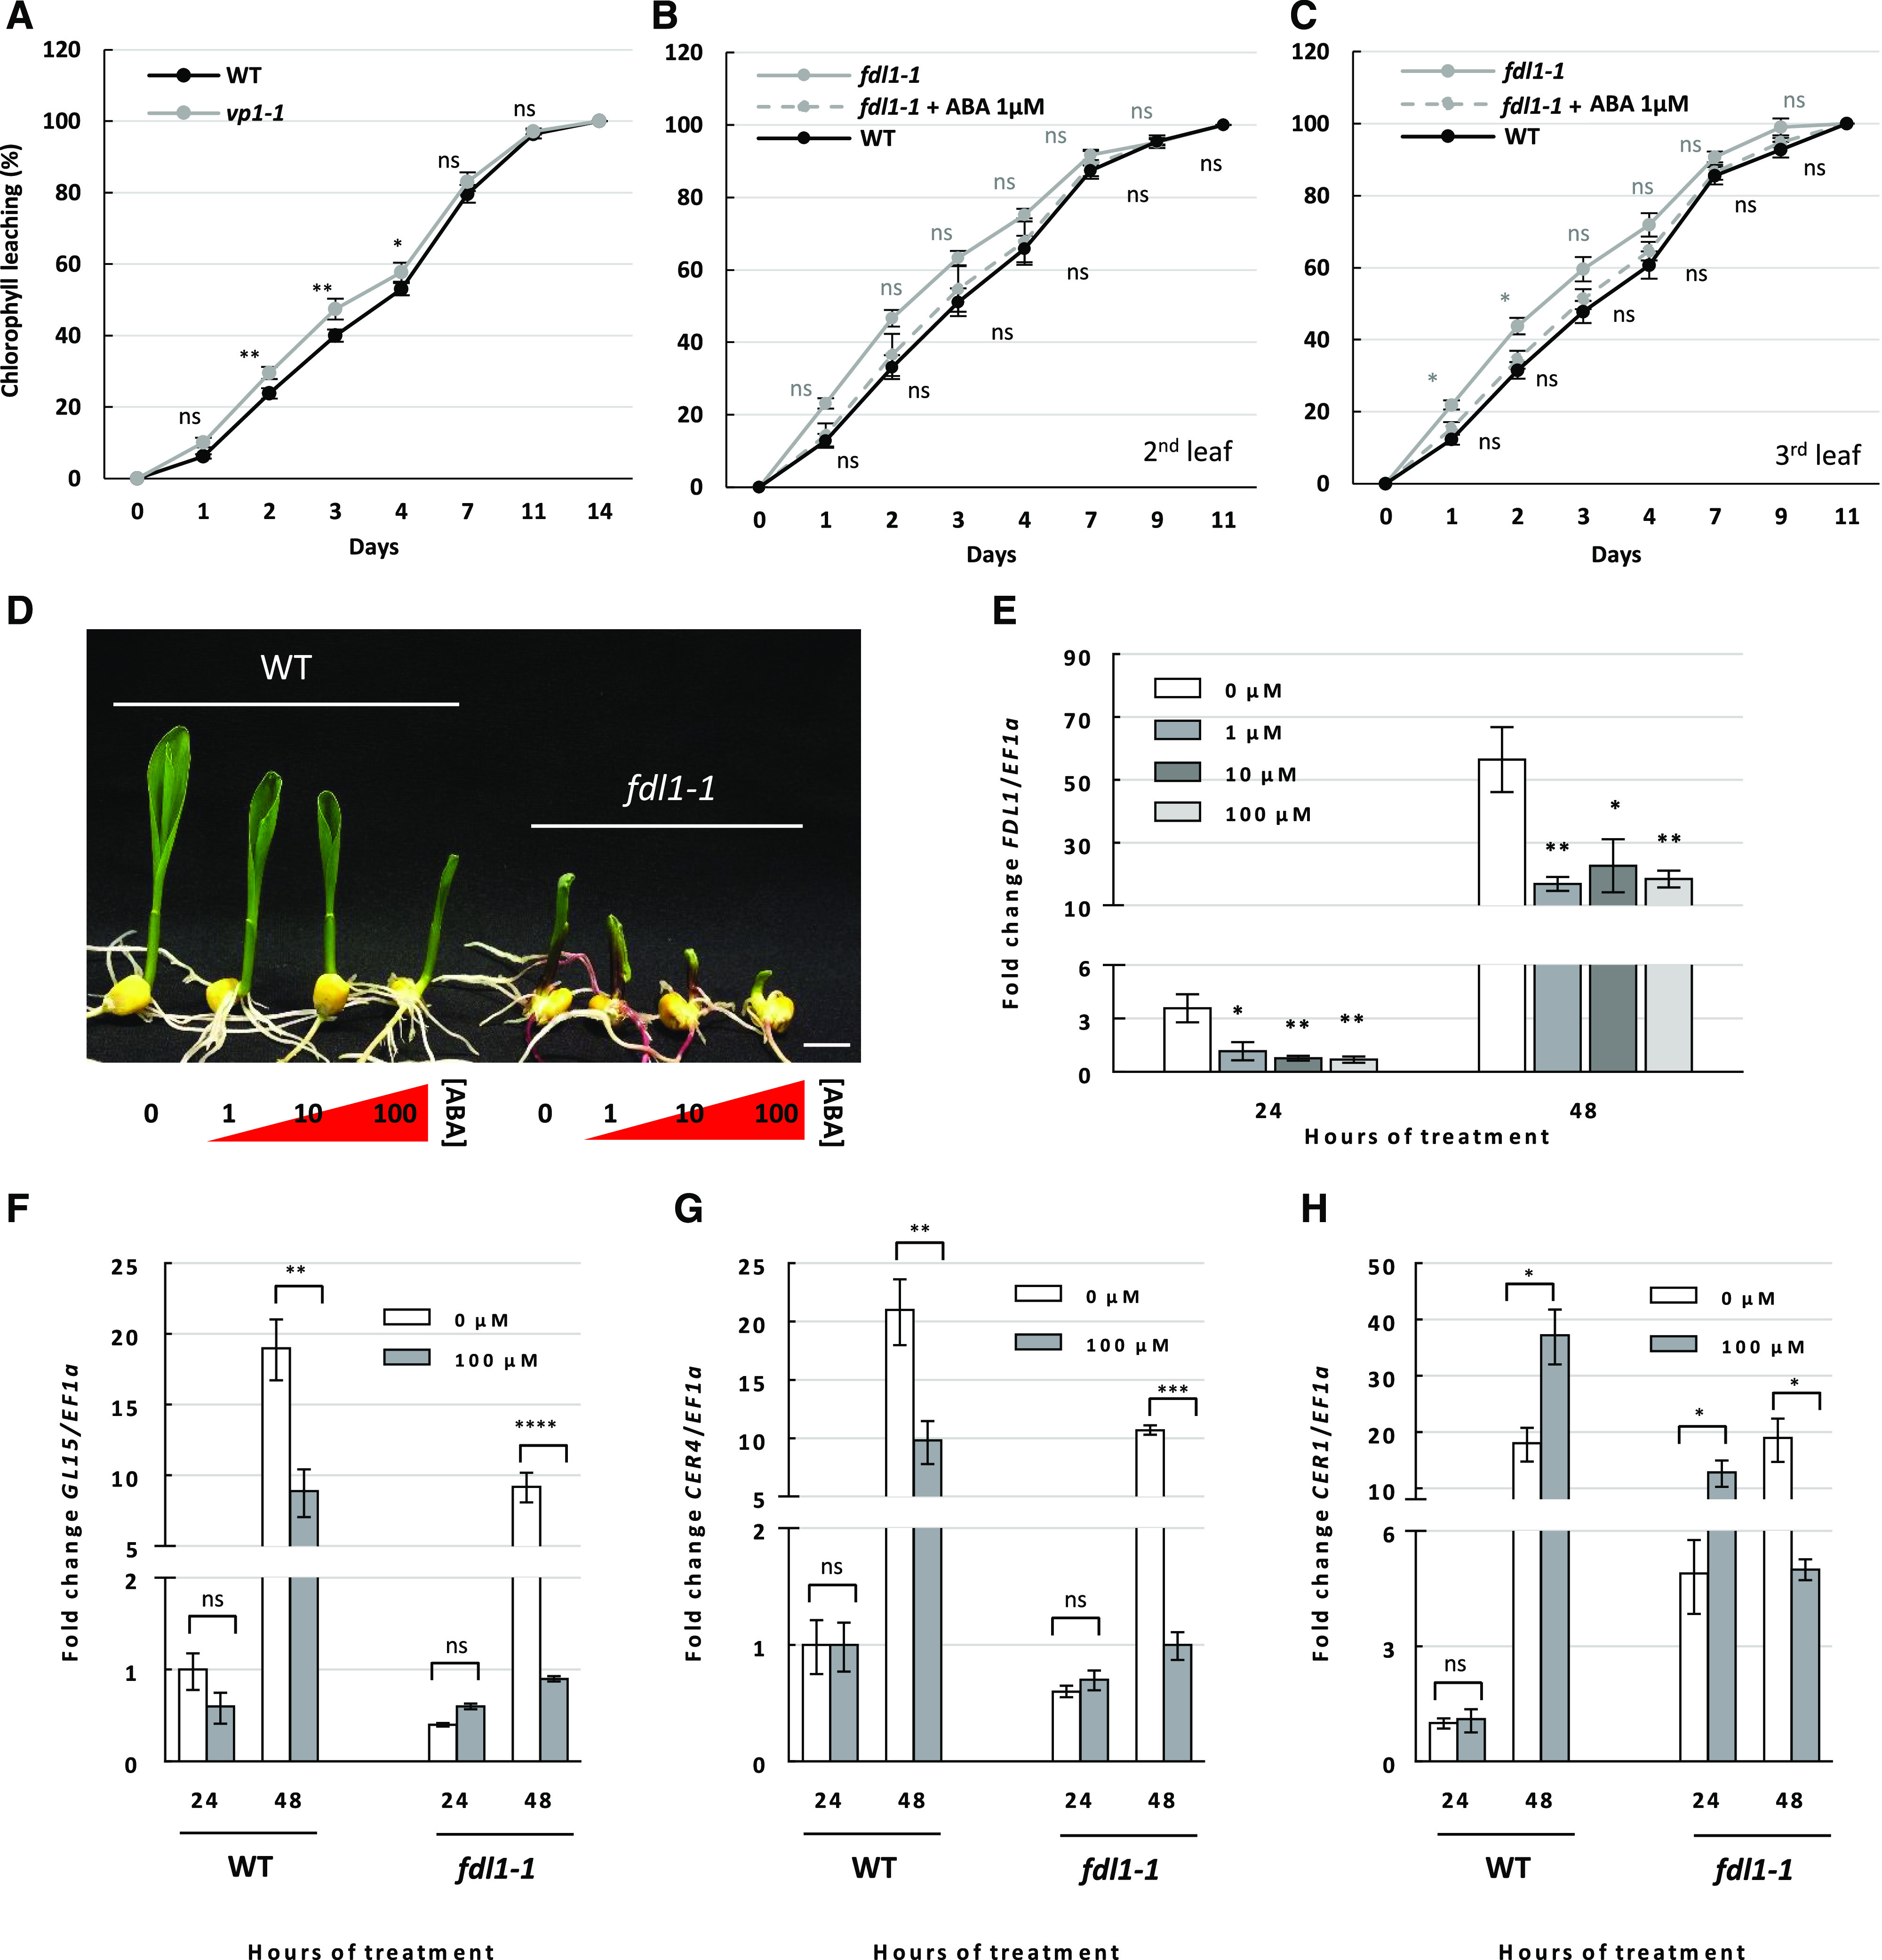
Effect of ABA treatment on leaf permeability and gene expression. A to C, Kinetics of chlorophyll leaching using the second fully expanded leaf of homozygous vp1-1 and B73 wild-type (WT) control plants (A) and the second (B) and third (C) leaves of fdl1-1 plants treated with a mock or 1 μm ABA solution and wild-type plants. Values represent the mean ± se of 10 biological replicates. D, Representative images of B73 wild-type and homozygous fdl1-1 mutant seedlings grown for 48 h with the root apparatus in liquid solutions with increasing ABA concentration (0, 1, 10, and 100 μm). Scale bar = 1 cm. E, Expression profile of ZmFDL1/MYB94 in wild-type plants after treatment with control (0 μm ABA) or 1, 10, and 100 μm ABA solution for 24 and 48 h. F to H, RT-qPCR analysis of the cuticle-related ZmGL15 (F), ZmCER4 (G), and ZmCER1 (H) genes in mock (0 μm ABA) or 100 μm ABA-treated wild-type and homozygous fdl1-1 mutant seedlings for 24 and 48 h. Values in E to G represent the mean fold change ± sd for a minimum of three independent biological replicates. Comparisons were made at each time point between wild-type and vp1-1 genotypes (A); between ABA and mock treatments in fdl1-1 (gray) and wild-type plants (black); or between control and ABA-treated plants (E–H). Significant differences were assessed by one-way ANOVA or Student’s t test (*P < 0.05; **P < 0.01; ***P < 0.001; and ****P < 0.0001; ns, not significant).
