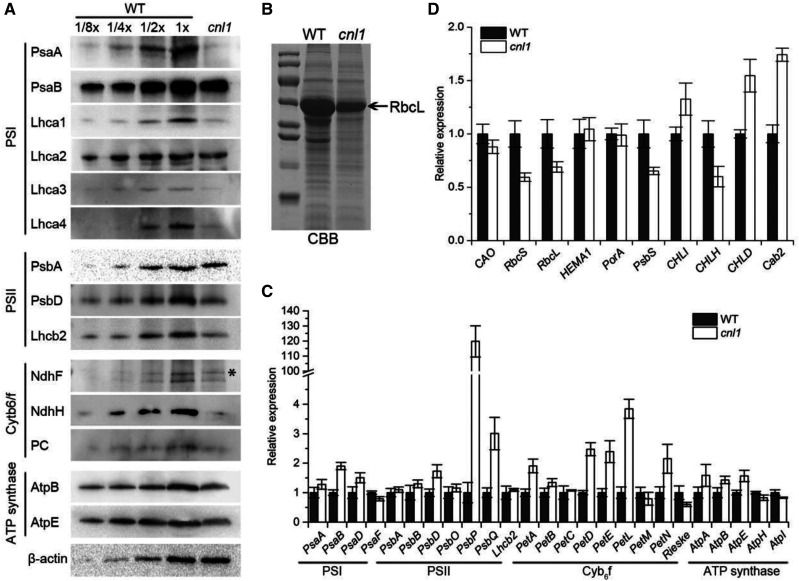
Figure 6.
Levels of thylakoid membrane proteins and expression of photosynthetic genes. A, Levels of thylakoid membrane proteins detected in total proteins from flag leaves of wild type (WT) and cnl1 at the heading stage. The wild-type dilution series contained 30 μg of proteins (1×) or the indicated dilutions, and the cnl1 contained 30 μg proteins. Antibodies used for detection are indicated on the left; the asterisk indicates an unspecific signal detected by the NdhF antibody. B, Total proteins of flag leaves from wild type and cnl1 mutant separated by SDS-PAGE and indicated by Coomassie Brilliant Blue (CBB) staining. C, Levels of plastid- and nucleus-encoded mRNAs related to thylakoid membrane proteins. D, Relative expression analysis of photosynthetic genes in wild-type and cnl1. Data are means ± sd (n = 3).

