Figure 1.
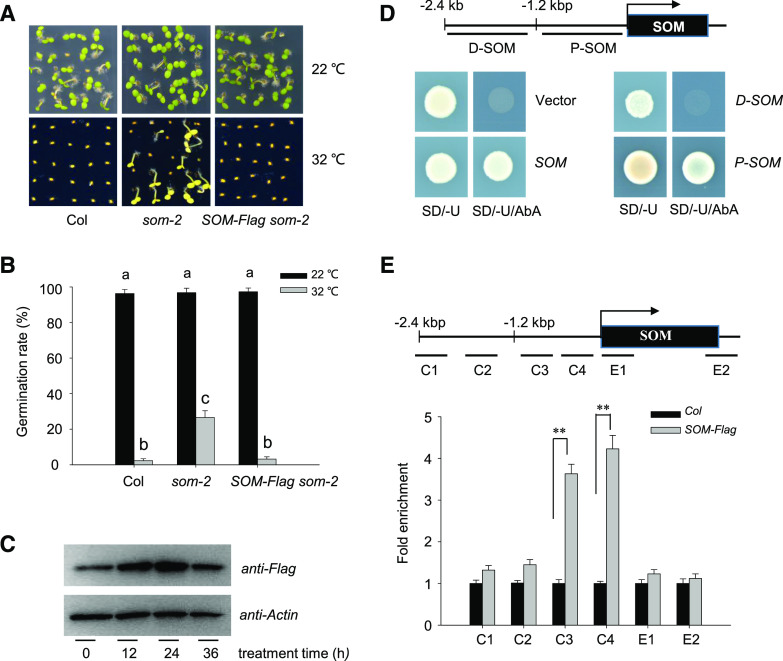
Identification of putative trans-regulatory factors of SOM expression. A and B, Seed germination phenotype of Col-0, som-2, and its complementation line (SOM-FLAG som-2) under normal conditions (22°C) or HT stress (32°C). Hydrated seeds were germinated on one-half-strength Murashige and Skoog medium with 1% (w/v) agar at 22°C or 32°C. Photographs were taken after 10 d (A). The experiment was repeated three times with similar results. Seed germination rates were calculated after 5 d (B). Values are means ± sd of three biological replicates; bars labeled with different letters are significantly different at P < 0.05 (Tukey’s test). C, HT increases SOM protein abundance in hydrated seeds. Seeds from SOM-FLAG som-2 were treated at 32°C for 0 to 36 h, and total protein extracts from hydrated seeds were analyzed by immunoblot with an anti-FLAG antibody. Actin was used as the loading control. The experiments were repeated three times, with similar results. D, SOM binds to its own promoter. The 2.4-kb SOM promoter fragment was cloned into the pABAi vector (pABAi-SOM, indicated as SOM) or the 2.4-kb fragment was evenly divided into a 5′ or 3′ fragment of 1.2 kb length each (pABAi-D-SOM and pABAi-P-SOM, indicated as D-SOM and P-SOM, respectively). The full-length SOM was fused to the pGBKT7 vector. Yeast cells were cotransformed with the combinations of various pABAi and pGBKT7 and grown on synthetic dropout (SD) medium lacking Ura (SD/-U) or lacking Ura but additionally aureobasidin A (SD/-U/AbA). The binding ability of SOM with the 2.4-kb promoter or the 1.2-kb proximal fragment is indicated by growth on the SD/-U/AbA plate. A diagram of the 2.4-kb fragment or the 1.2-kb distal (D-SOM) or proximal (P-SOM) fragment of the SOM promoter is shown on top. E, ChIP-qPCR analysis of the binding ability of SOM to its own promoter. Hydrated SOM-FLAG transgenic seeds and wild-type Col-0 seeds were used for ChIP-qPCR using an anti-FLAG antibody. ACTIN2 served as an internal control. Enrichment was normalized to the level of input DNA. Values are shown as means ± sd of triplicate experiments. Asterisks indicate significant difference by Student’s t test (**P < 0.01). The top diagram indicates the genomic structure of SOM. Black boxes indicate exons. P1 to P4, E1, and E2 fragments show PCR regions amplified during ChIP.

