Figure 5.
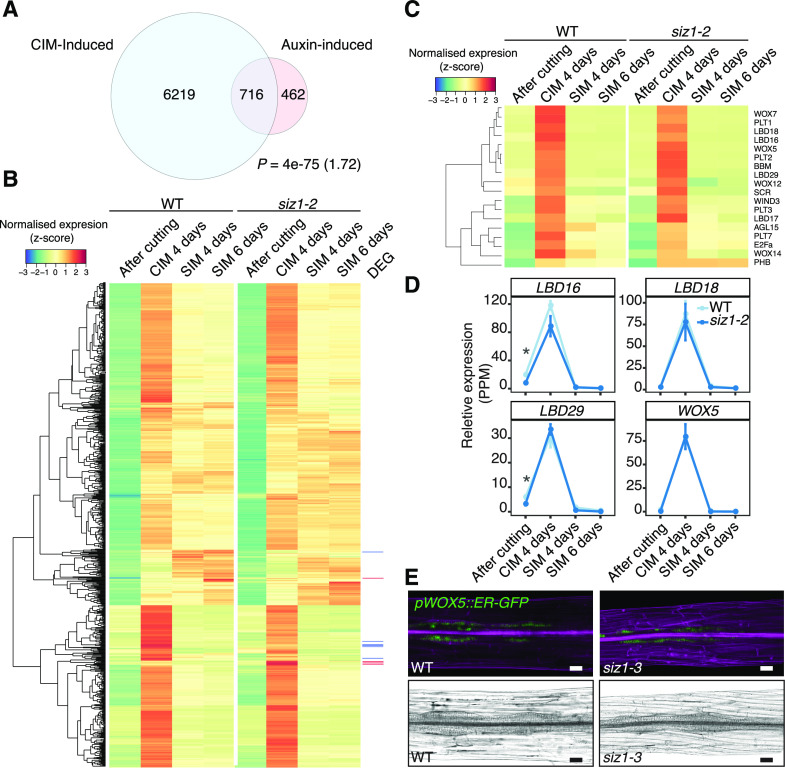
Expression of CIM-induced callus genes is largely unchanged in the siz1-2 mutant. A, Venn diagram showing overlap between auxin-inducible (IAA-induced) genes and CIM-inducible genes. The IAA-induced gene list was generated by combining datasets from Nemhauser et al. (2006; 430 genes), Omelyanchuk et al. (2017; 789 genes), and AtGeneExpress (ExpressionSet: 1007965859; Goda et al., 2008; 103 genes). CIM-induced genes are those up-regulated in the wild type (WT) after a 4-d incubation on CIM compared to after cutting (edgeR, false discovery rate [FDR] < 0.01). The significance of overlap between pairs of gene sets was evaluated by a hypergeometric test. The calculated representation factor is shown in brackets. B, Heatmap showing an absence of significant changes in expression between siz1-2 and wild-type plants, based on our RNA-seq analysis, for genes inducible by both IAA and CIM incubation identified in A. Normalized expression was calculated for each gene across all time points, using data from both genotypes. Differentially expressed genes (DEG) are marked in red for up-regulated genes in siz1-2 at CIM 4 d and in blue for down-regulated genes. C, Heatmap showing an absence of significant changes in expression between siz1-2 and wild-type plants for transcriptional regulators that are involved in callus formation and pluripotency acquisition according to Ikeuchi et al. (2019). Gene expression was normalized as in B. D, Relative expression of a selection of genes from the heatmap in C in siz1-2 versus wild-type plants. Error bars represent ± SE. Asterisks inidacte statistical significance of the difference is indicated based on edgeR analysis from the RNA-seq data (*P < 0.05). E, Expression of the pWOX5::ER-GFP marker (green), visualized using confocal microscopy, in siz1-3 and wild-type hypocotyl explants after 4 d on CIM. Samples were stained with propidium iodide (magenta) to stain cell walls (top). Images of the same hypocotyl explants visualized using light microscopy (bottom). Scale bars = 50 µm.

