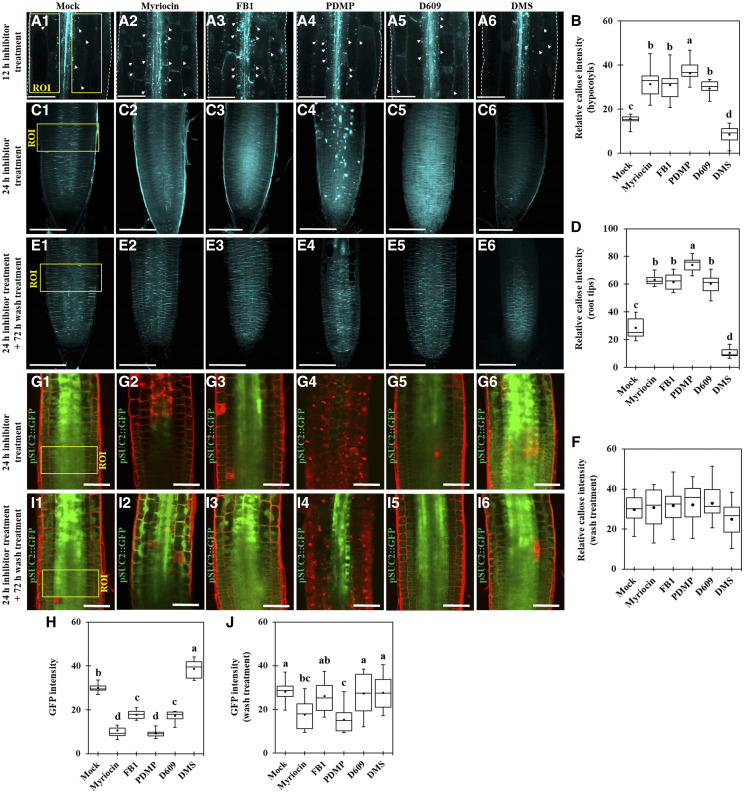
Figure 1.
Perturbation in the SL pathway alters PD permeability in Arabidopsis hypocotyls and root tips. A1 to A6, Confocal images show Aniline Blue-stained callose in Arabidopsis etiolated hypocotyls after SL inhibitor treatment (12 h). White arrowheads show Aniline Blue-stained callose at PD. Bars = 100 μm. B, Quantitative data show the relative callose intensity of Arabidopsis etiolated hypocotyls after SL inhibitor treatment (A1–A6; n = 15). C1 to C6, Confocal images show Aniline Blue-stained callose in Arabidopsis root tips after SL inhibitor treatment (24 h). Bars = 100 μm. D, Quantitative data show the relative callose intensity of Arabidopsis root tips after SL inhibitor treatment (C1–C6; n = 15). E1 to E6, Confocal images show Aniline Blue-stained callose in Arabidopsis root tips. Images were captured right after wash treatment (replaced to the normal agar plates, 72 h) from SL inhibitor treatment (24 h). Bars = 100 μm. F, Quantitative data show the relative callose intensity of Arabidopsis root tips after wash treatment (E1–E6; n = 9). G1 to G6, Confocal images of root tips of Arabidopsis transgenic plants expressing pSUC2::GFP. Images were captured right after SL inhibitor treatment (24 h). Bars = 50 μm. H, Quantitative data show the GFP fluorescence intensity of Arabidopsis root tips expressing pSUC2::GFP after SL inhibitor treatment (G1–G6; n = 12). I1 to I6, Confocal images of root tips of Arabidopsis transgenic plants expressing pSUC2::GFP. Images were captured right after wash treatment from SL inhibitor treatment (24 h). Bars = 50 μm. J, Quantitative data show the GFP fluorescence intensity of Arabidopsis root tips expressing pSUC2::GFP after wash treatment (I1–I6; n = 12). Yellow boxes indicate regions of interest (ROI) for callose quantification (A1–A6 and C1–C6) and GFP fluorescence intensity quantification (G1–G6 and I1–I6). Three independent biological replicates were performed for each experiment, and statistical significance was determined by one-way ANOVA with the Tukey-Kramer test. Boxes in box plots shows 25th to 75th percentiles. Black dots and lines in boxes indicate mean and median, respectively. Significant differences are indicated by the presence of different lowercase letters above each box plot (P < 0.05).

