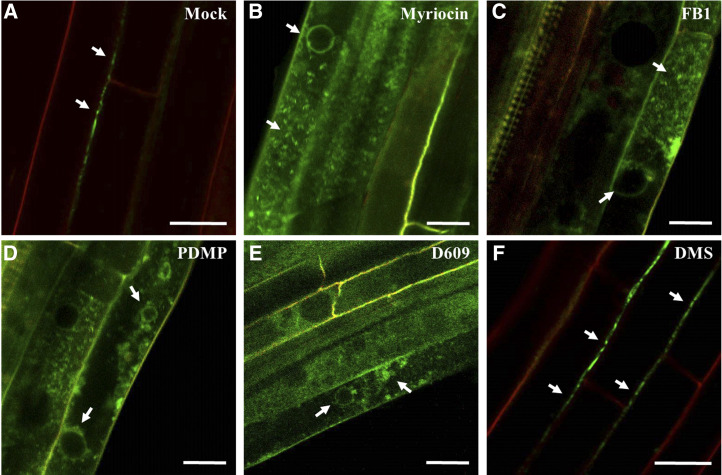
Figure 4.
Subcellular localization of PdBG2 after SL inhibitor treatment in Arabidopsis hypocotyls. Confocal images show Arabidopsis hypocotyls expressing fluorescent fusion protein of PdBG2 after SL inhibitor treatment (24 h) as follows: mock (A), 0.1 μm myriocin (B), 5 μm FB1 (C), 50 μm PDMP (D), 40 μm D609 (E), and 30 μm DMS (F). White arrows indicate GFP:PdBG2 localizations. Red signals show propidium iodide staining of the cell wall. Bars = 20 μm.

