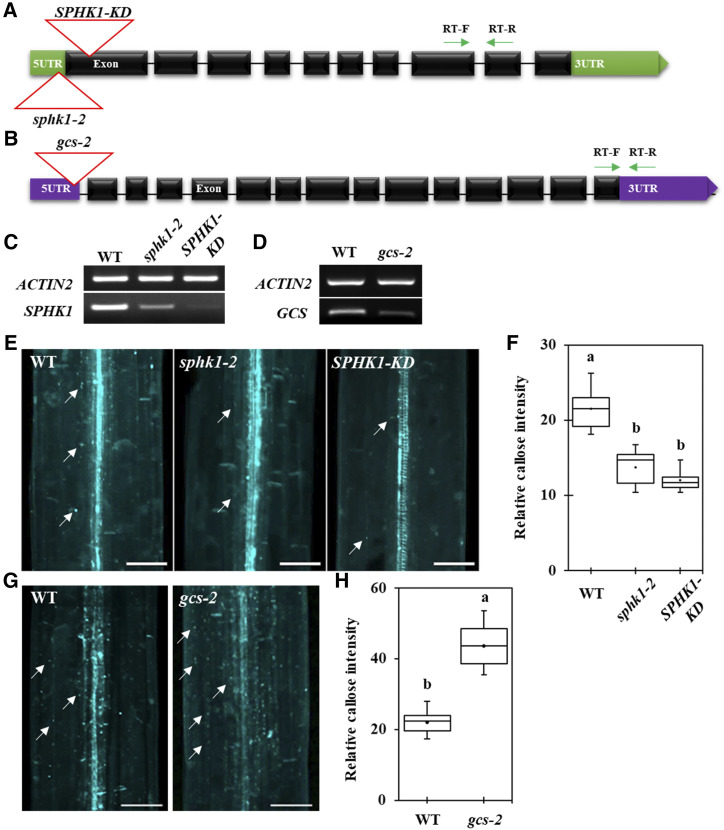
Figure 5.
Callose level is altered in the sphk1-2, SPHK1-KD, and gcs-2 mutants. A, Gene organization of SPHK1 and its T-DNA insertion alleles. Green arrows indicate RT primer locations for C. B, Gene organization of GCS and its T-DNA insertion allele. Green arrows indicate RT primer locations for D. C, SPHK1 transcript expression with alleles containing the T-DNA insertion. D, GCS transcript expression with alleles containing the T-DNA insertion. E, Confocal images show Aniline Blue-stained callose in Arabidopsis etiolated hypocotyls of different genotypes (the wild type [WT], sphk1-2, and SPHK1-KD). F, Quantitative data show the relative callose intensity of E. G, Confocal images show Aniline Blue-stained callose in Arabidopsis etiolated hypocotyls of different genotypes (the wild type and gcs-2). H, Quantitative data show the relative callose intensity of G. In E and G, white arrows show Aniline Blue-stained callose at PD. Bars = 80 μm. In F and H, statistical significance was determined by one-way ANOVA with the Tukey-Kramer test (n = 15, three independent biological experiments). Boxes shows 25th to 75th percentiles. Black dots and lines in boxes indicate the mean and median, respectively. Significant differences are indicated by the presence of different lowercase letters above each box plot (P < 0.05).

