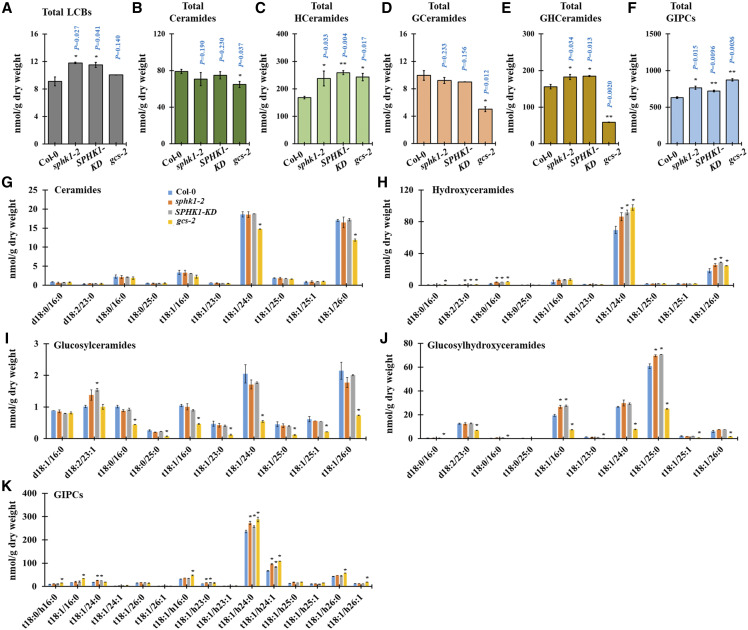
Figure 6.
SL homeostasis is altered in the sphk1-2, SPHK1-KD, and gcs-2 mutants. A to F, Measurement of SLs from sphk1-2, SPHK1-KD, and gcs-2 mutant plants included total LCBs (A), total ceramides (B), total hydroxyceramides (C), total GlcCer (D), total GlcHCer (E), and total GIPC (F). G to K, SL species characterized by LCB (d18:0, d18:1, d18:2, t18:0, and t18:1) and fatty acids (16:0–26:1) from sphk1-2, SPHK1-KD, and gcs-2 mutant plants included ceramides (G), hydroxyceramides (H), GlcCer (I), GlcHCer (J), and GIPC (K). Measurements are averages of four independent biological experiments (n = 200). Data are means ± sd. Statistical significance was determined by two-tailed Student’s t test (*P < 0.05 and **P < 0.01).

