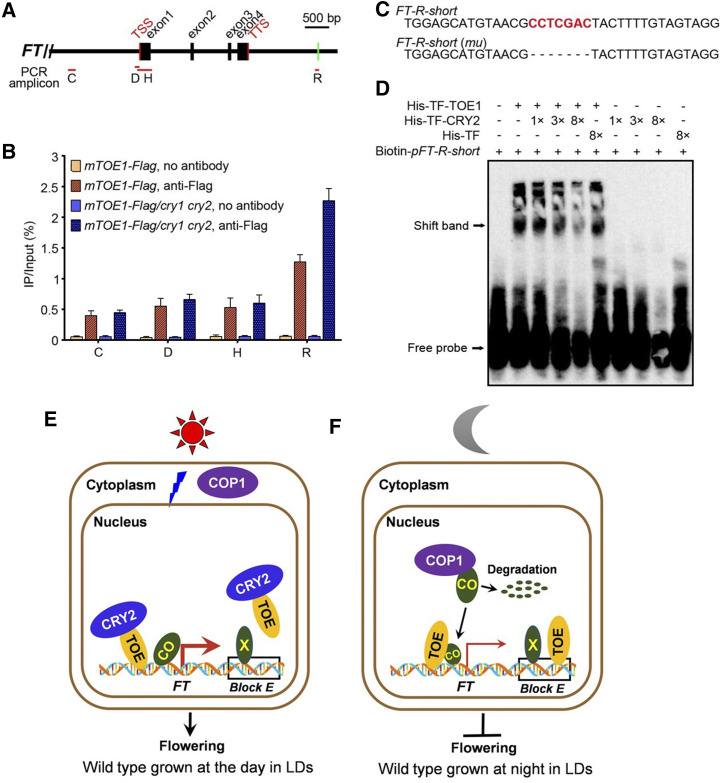
Figure 7.
CRY2 inhibits TOE1 binding to the 3′ downstream regulatory region of FT. A, Schematic drawing of the FT genomic region and locations of fragments amplified in ChIP experiments. Positions of the transcription start site (TSS) and transcription termination site (TTS) are indicated. Red lines denote fragments amplified in ChIP-qPCR (B; Supplemental Fig. S8A). Green bar including CCTCGAC element used as an EMSA probe (pFT-R-short) is indicated. B, ChIP-qPCR assays showing CRY2 inhibition of DNA-binding activity of TOE1 in Arabidopsis. The histogram shows the enrichment of the C, D, H, and R region of the FT chromatin. ChIP-qPCR was performed with 14-d-old mTOE1-Flag seedlings in wild-type and cry1 cry2 mutant backgrounds grown under LDs and harvested in ZT16. Genomic DNA fragments were immunoprecipitated by anti-Flag antibody and no-antibody immunoprecipitate served as control. IP/input (%) was calculated by comparison with the cycle threshold values between immunoprecipitate and input. Values are means ± sd of two independent ChIP assays. C, The core sequences of probes for binding by TOE1 in D and Supplemental Figure S8B. Probe FT-R-short is from the FT region R, containing CCTCGAC elements. FT-R-short (mu) denotes EMSA probe FT-R-short lack CCTCGAC element. D, EMSAs showing CRY2 inhibition of TOE1 DNA-binding ability. EMSA was performed with His-TF-TOE1 and His-TF proteins using Biotin-pFT-R-short as probes. The terms “1×,” “3×,” and “8×” indicate the amount of His-TF-CRY2 and His-TF relative to that of His-TF-TOE1. Free probe and TOE1-DNA–specific shift band are indicated by arrows. E, Model showing the action of CRY2, TOE, COP1, and CO in wild-type plants. During the light period in LDs, as COP1 and CO are localized in the cytoplasm and the nucleus, respectively, CO is stable and accumulates. BL-triggered CRY2-TOE interaction inhibits not only the association of TOE with CO to enhance the transcriptional activity of CO, but also the binding of TOE to the 3′ regulatory element within Block E enhancer of FT, leading to FT transcription and flowering. “X” denotes the unknown transcriptional activators binding to the element within the Block E enhancer that promotes FT transcription. The thick red arrow denotes high-level FT transcription. F, A model showing the action of TOE, COP1, and CO during the dark period in LDs. In DK, as COP1 and CO are localized in the nucleus and interact, CO undergoes ubiquitination and degradation, resulting in low-level CO accumulation and repression of FT transcription and flowering. Moreover, TOE binds to the regulatory element within Block E, leading to further inhibition of FT expression and flowering. The thin red arrow denotes low-level FT transcription.

