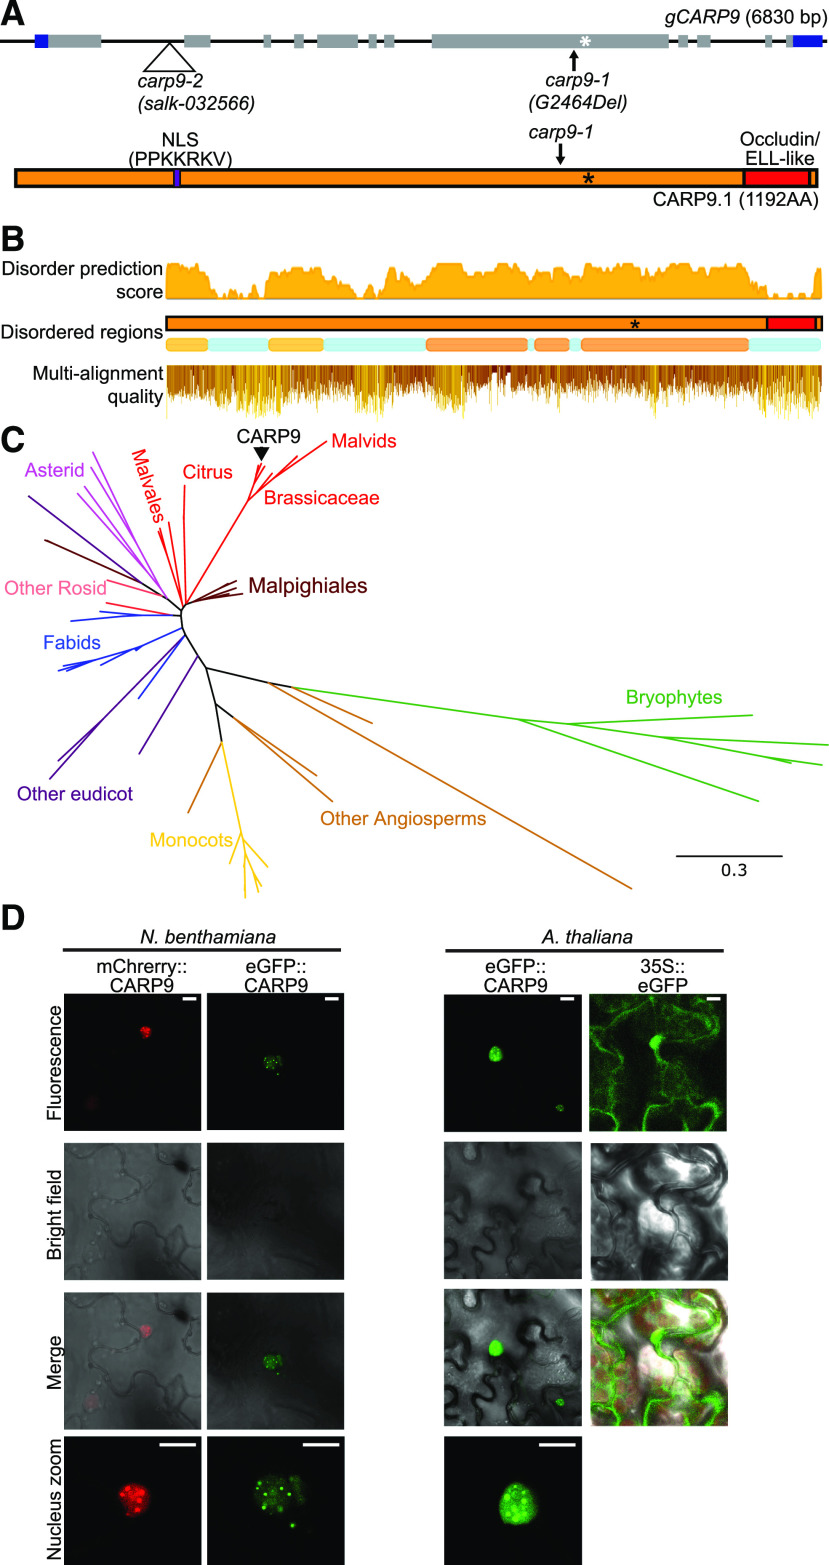
Figure 3.
Conservation analysis of CARP9 across the plant kingdom. A, Top, gene structure of CARP9 as shown in Figure 1A. Bottom, the CARP9 protein structure; in purple is marked a putative NSL signal and its amino acid sequence. The occluding/ELL-like domain is marked in red. B, Top and middle, disordered score, and regions in AtCARP9 amino acid sequence according to MobiDB (Piovesan et al., 2018). Bottom, amino acid alignment quality of CARP9-like genes using Jalview software (Waterhouse et al., 2009); positions are based on AtCARP9 full sequence. C, Phylogeny of CARP9-like genes in embryophytes. The unrooted consensus tree was generated using the maximum likelihood method. Colors represent different lineages of plant species, referenced in the figure. AtCARP9 is highlighted with a black arrow. Supplemental Figure S3B shows the fully annotated tree. D, Confocal microscopy images showing the nuclear localization of eGFP- and mCherry-tagged versions of CARP9 in Nicotiana benthamiana transiently transformed leaves (left) and stably transformed Arabidopsis plants (right). Scale bars = 5 μm.

