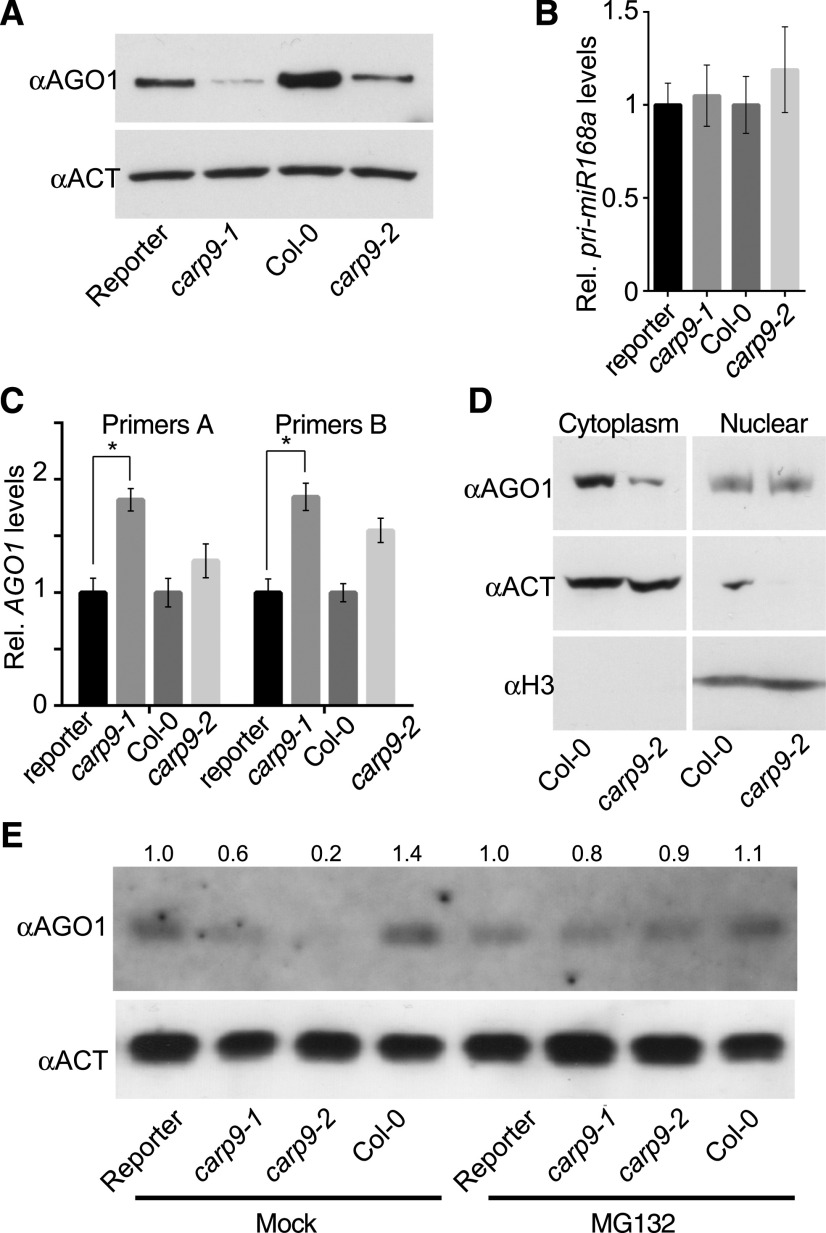
Figure 6.
AGO1 stability is compromised in CARP9 mutants. A, AGO1 levels quantified by immunoblot in samples extracted from carp9 mutants and control plants. Levels of ACTIN were measured as a loading control. B and C, Expression of pri-miRNA168 (B) and AGO1 (C) as measured by RT-qPCR. AGO1 transcript levels were measured using two sets of primers; a pair amplifying the 3′ end of the transcript (Primers A) and a pair flanking the miR168 recognition site in the AGO1 mRNA (Primers B). Error bars show means ± 2× se (n = 4. Asterisks indicate significance by two-tailed, unpaired t test (*P < 0.05). D, AGO1 levels, as measured by immunoblots, in cytoplasmic or nuclear cell fractionated samples. ACTIN and Histone 3 (H3) were used to verify the purity of the fractions. E, Immunoblot quantification of AGO1 levels in mutant and control plants treated with the proteasome inhibitor MG132.

