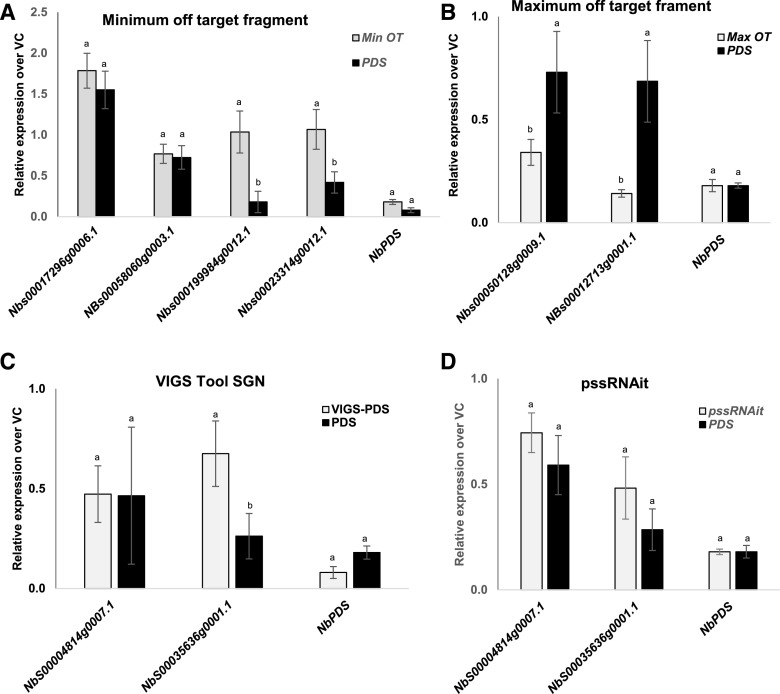
Figure 5.
Expression analysis of off-target genes in N. benthamiana plants expressing maximum off-target (MaxOT), minimum off-target (MinOT), VIGS-SGN, and pssRNAit predicted RNAi constructs in comparison with the vector control (VC) and NbPDS fragment. A and B, Expression level of off-target genes when using the minimum (A) and maximum (B) off-target construct. C and D, VIGS-SGN predicted (C) and pssRNAit–predicted (D) constructs. The off-target genes were identified using pssRNAit and the levels of expression were assessed using RT-qPCR. In each case, a minimum of three biological replicates were used for expression analysis. Bars represent the mean ± se. Different lowercase letters on data points indicate a significant difference (P < 0.05) between PDS and the respective minimum or maximum off-targets, determined by two-way ANOVA with Tukey's HSD mean-separation test.

