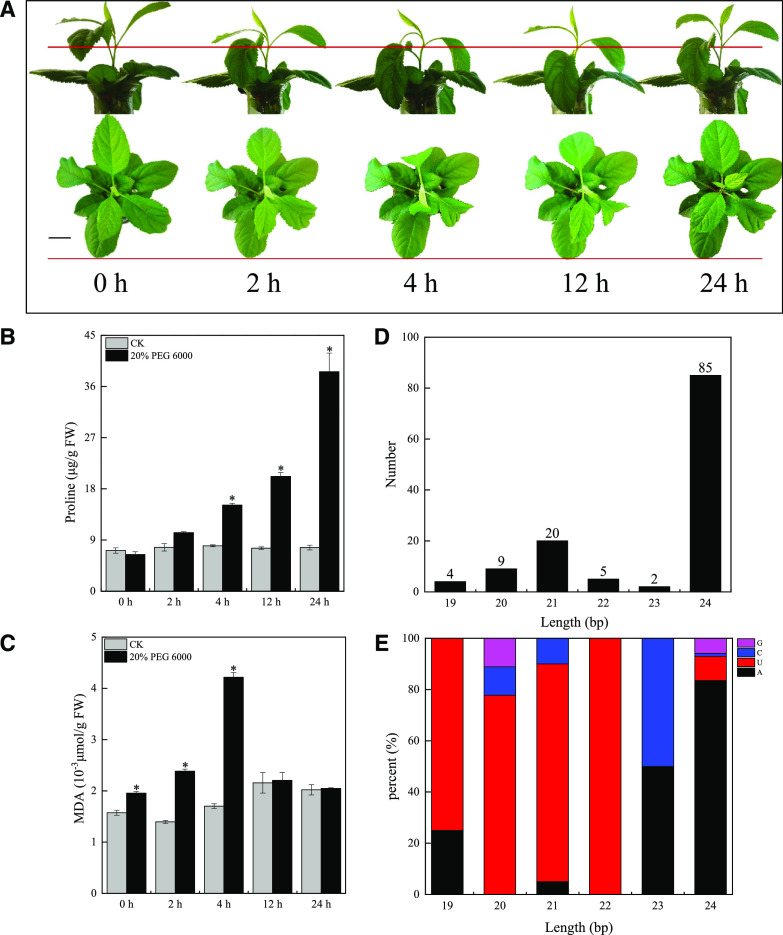
Figure 1.
Phenotypic changes in M. sieversii under drought stress and snRNA identification. A, Phenotypic changes in M. sieversii under drought stress. The plants have been digitally extracted for comparison. Scale bar = 1 cm. Red lines mark the same position of the plant, highlighting phenotypic changes over time. B and C, Changes in leaf Proline and MDA contents in M. sieversii treated with 20% (w/v) PEG 6000. Data are presented as means ± sd from three biological replicates. Asterisks indicate significant differences in Pro and MDA contents between the treatments and controls based on Duncan’s multiple range test (*P < 0.05). D, Length distribution of new snRNAs in M. sieversii. E, Proportion of the first bases of new snRNAs in M. sieversii. FW, Fresh weight; CK, control check.

