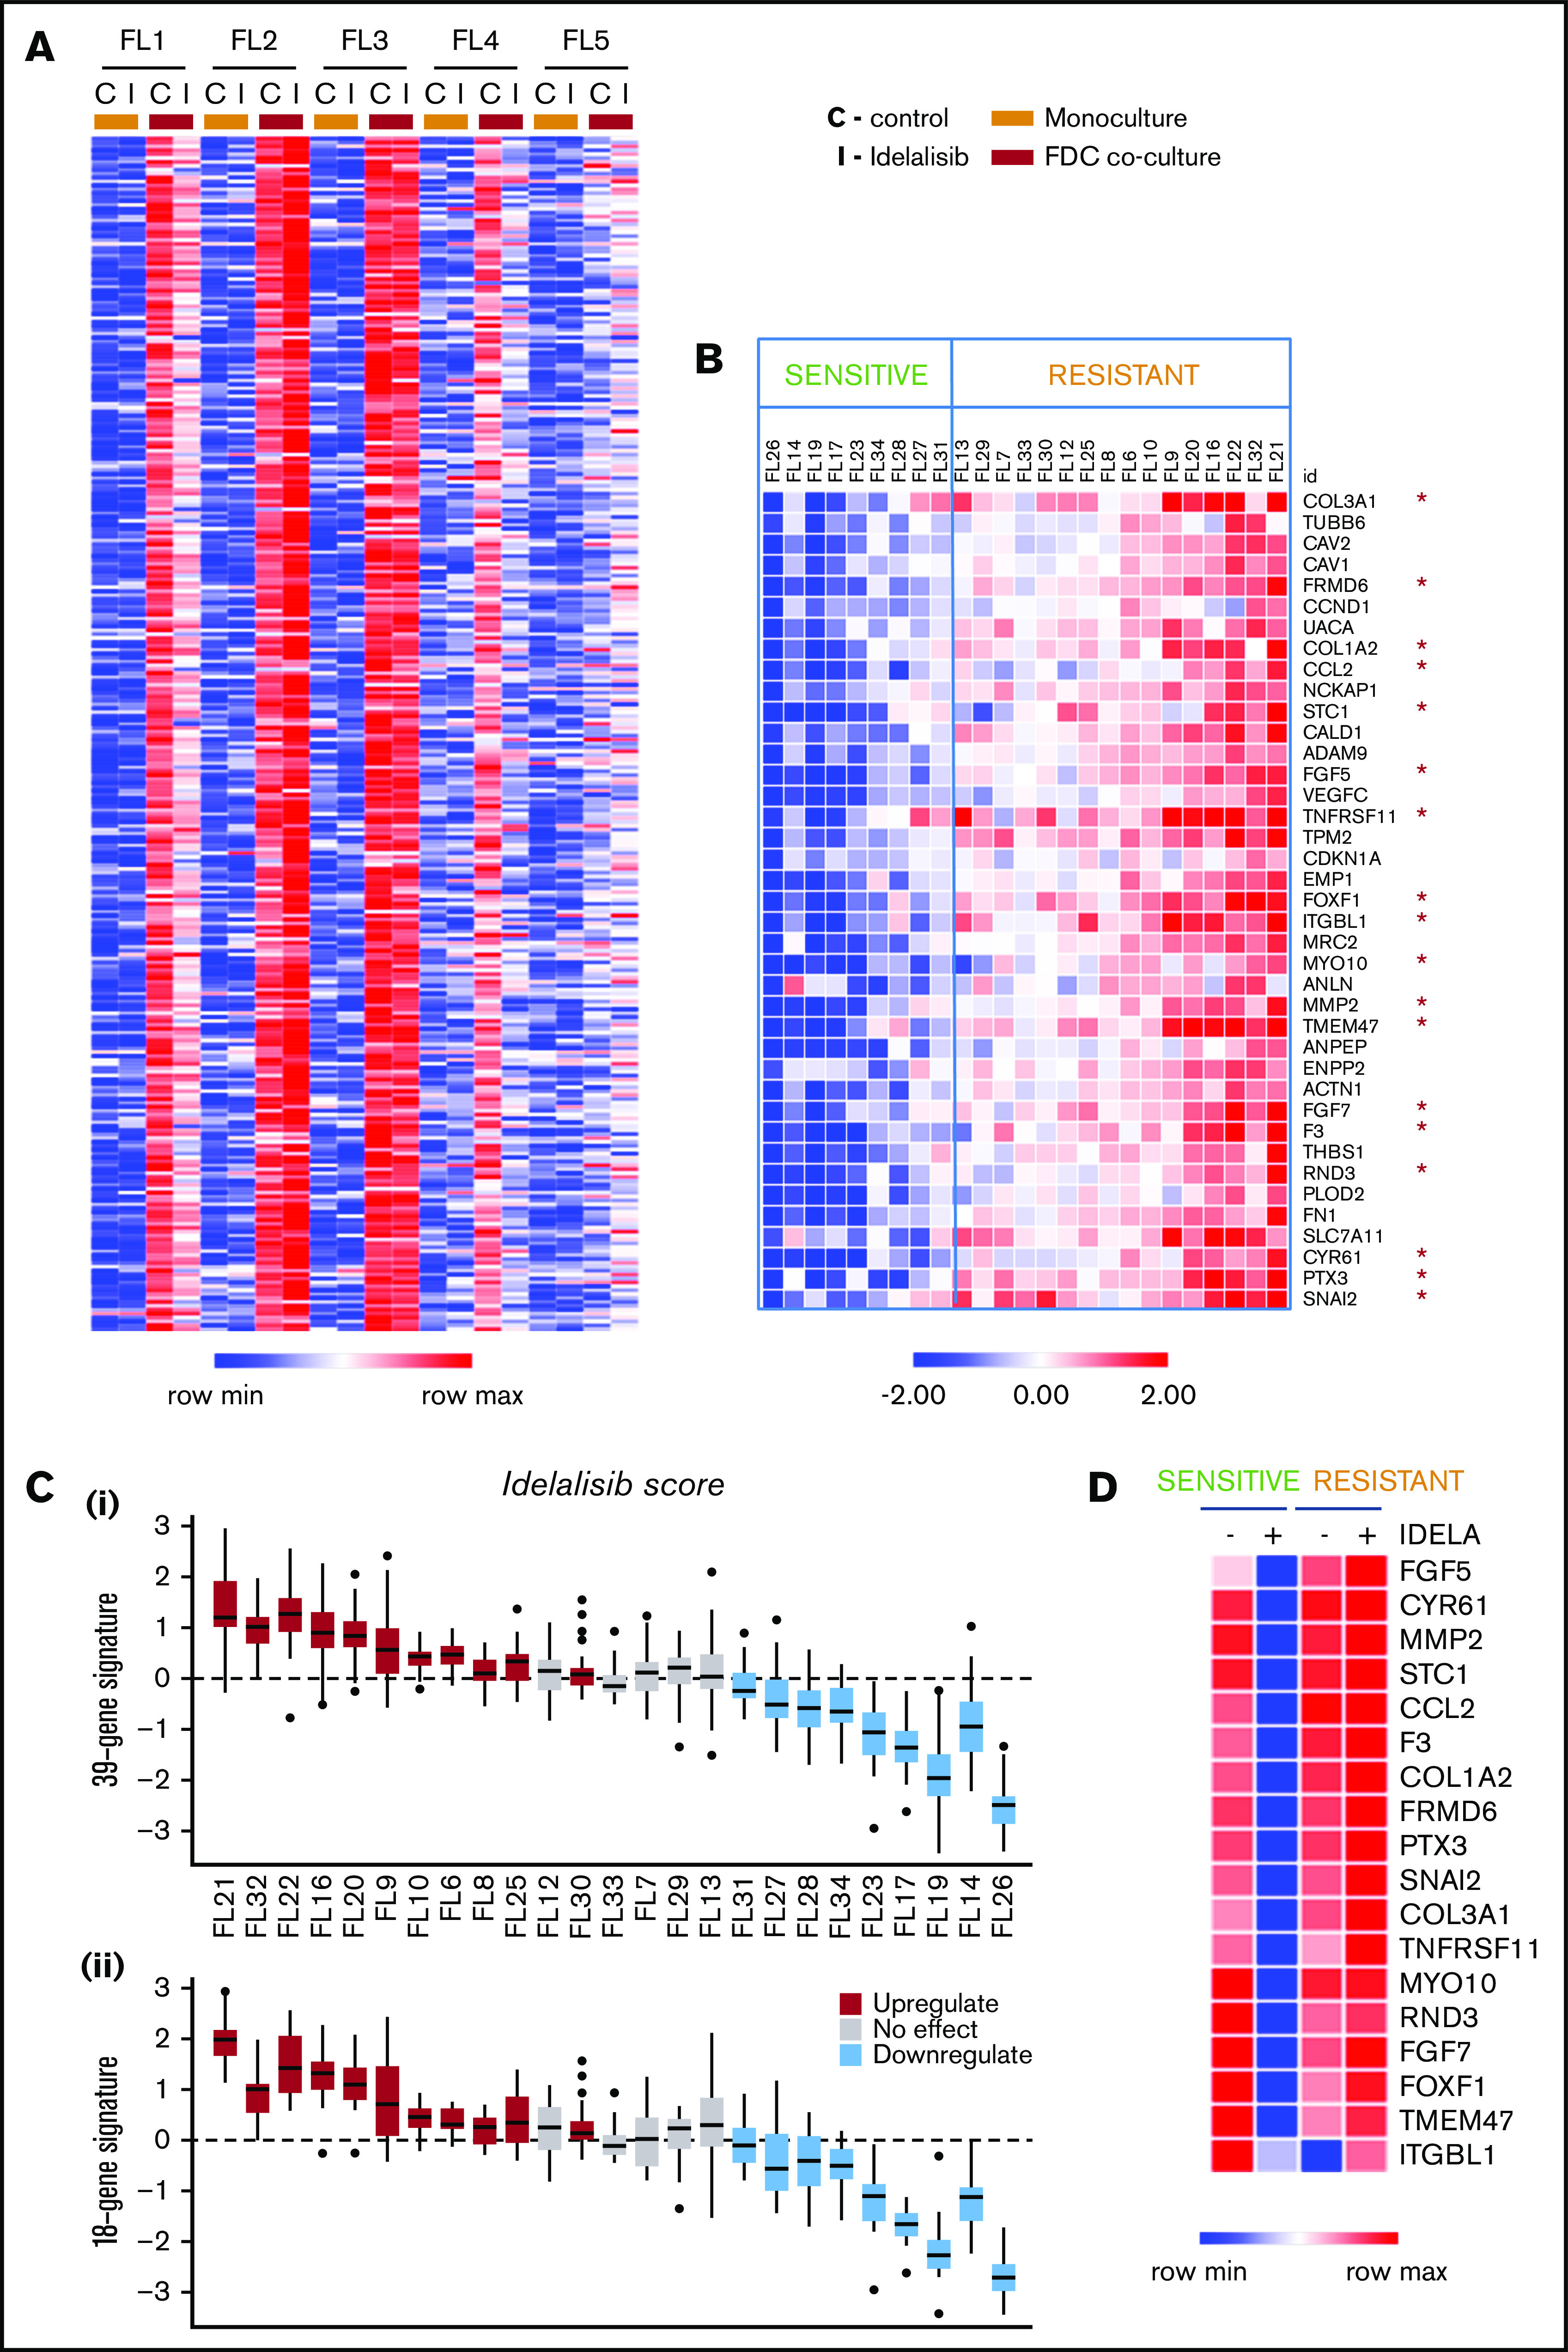
Figure 1.

Idelalisib modulates FDC-induced gene sets in selected FL patients. (A) FL primary cells (n = 5) were isolated from monocultures or FL-FDC cocultures, treated with and without idelalisib (500 nM, 48 hours), RNA extracted, and subjected to GEP. Robust multiarray average data were analyzed with a paired (monoculture vs coculture) Limma algorithm (false discovery rate < 0.05, fc > 2). Heatmap represents the genes significantly upregulated in FL cells by FDCs in 4 of 5 patients. A differential regulation by idelalisib was acknowledged. (B) FL primary cells were isolated from FL-FDC (n = 25) cocultures treated with and without idelalisib (500 nM, 48 hours), and RNA was extracted and subjected to a multiplex reverse transcription-polymerase chain reaction by Fluidigm to characterize 39 selected genes upregulated in the FL-FDC coculture (fc > 2) and differently modulated by idelalisib (fc < 0.5 in sensitive patients). Heatmap displays fc in response to idelalisib referred to the untreated control. The cutoff to consider idelalisib sensitive was established using a paired t test comparing the expression −/+ idelalisib adjusted with the Benjamini-Hochberg method (details in supplemental Methods). (C) Boxplots for each patient of the log2 fc expression in response to idealisib. (i) Full 39-gene signature. (ii) Reduced 18-gene signature (details in supplemental Methods). The median represented in each box plot corresponds to the idelalisib score. (D) Heatmap displaying the mean expression of the selected 18 genes in either sensitive (n = 9) and resistant (n = 16) patients classified as in panel B, referred to the baseline control without coculture.
