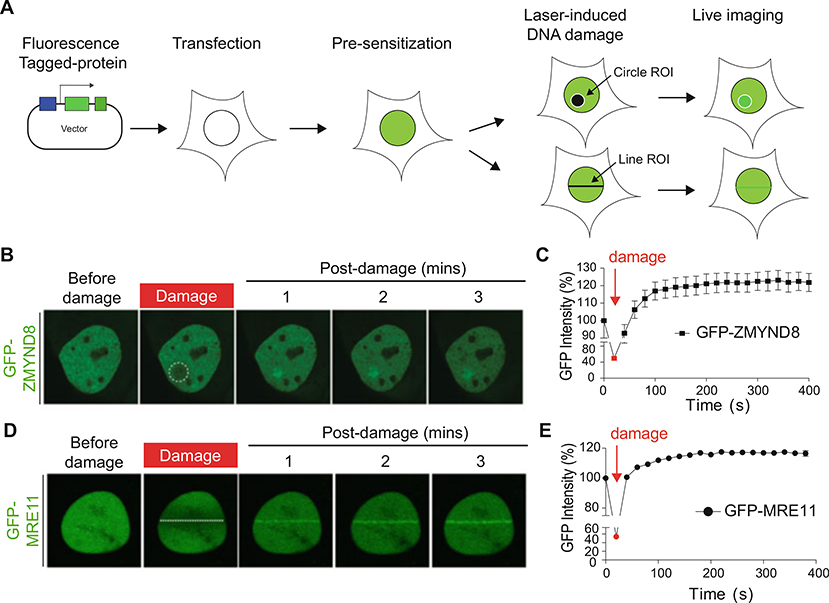
Fig. 1.
Laser microirradiation and live imaging of fluorescently tagged repair protein translocation to DNA damage sites. (a) Schematic illustration of live imaging for protein recruitment to DNA damage sites. (b) Laser damage-induced recruitment of GFP-tagged DDR protein ZMYND8. The white circle indicates the laser path defined by the ROI. (c) Quantification of the GFP intensity using laser microirradiation. The fluorescence intensity of GFP-ZMYND8 in b of damaged versus undamaged regions are plotted as the relative GFP intensity at each time point. Error bars indicate SEM; n > 10. (d) Laser damage-induced recruitment of GFP-tagged DDR protein MRE11. The white line indicates the laser path defined by the ROI. (e) Quantification of d as in c

