
Fig. 2. Transcriptome and epigenetic analyses of R-VEC signatures.
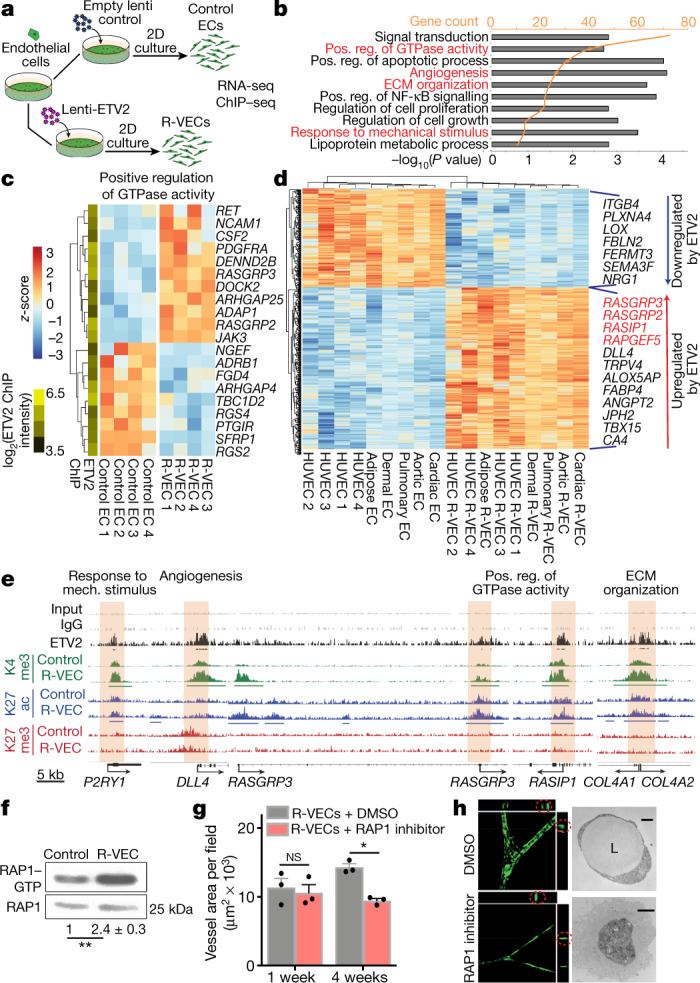
a, Schematic of RNA-seq and ChIP–seq performed in the induction phase (day 14) on R-VECs and control ECs. b, RNA-seq of R-VECs or control HUVECs in stage 1 (2D monolayers). GO term analysis was performed on differentially expressed genes. GO categories are ordered on the basis of the number of differentially expressed genes. Heat maps for GO categories in red are presented in Fig. 2c and Extended Fig. 6b. ECM, extracellular matrix; Pos. reg., positive regulation. c, Heat map of genes in one top GO category. Values are log2-normalized counts per million (CPM), centred and scaled by row. ETV2 binding from ChIP–seq at the promoter of each differentially expressed gene is shown in the yellow-and-green heat map (left). d, Heat map of 490 differentially expressed genes across ECs of different tissues (stage 1, induction phase) upon ETV2 expression. Tissue-adjusted log2-transformed CPM, centred and scaled by row. e, ETV2 ChIP–seq in R-VECs during the induction phase (stage 1; 2D) using an anti-Flag antibody or mouse IgG as control. ChIP for H3K4me3, H3K27ac and H3K27me3 was performed in both control ECs and R-VECs at stage 1. Enriched regions were analysed by ChIP–seq. Horizontal bars underneath peaks represent significantly changed regions. Promoter regions bound by ETV2 are highlighted in cream. Track range ETV2/K27me3/K27ac, 0–0.3; K4me3/input/IgG, 0–1. f, Western blot for active RAP1–GTP compared to total RAP1 input for stage 1 2D control ECs (HUVECs) and R-VECs (HUVEC-ETV2). The quantification of RAP1–GTP compared to total RAP1 is shown below the blot and presented as mean ± s.e.m. g, Quantification of R-VEC vessel formation after treatment with RAP1 inhibitor or dimethyl sulfoxide (DMSO). h, Z-stack confocal images and electron microscopy images of R-VEC vessels treated with RAP1 inhibitor or DMSO at four weeks. Red circles indicate orthogonal cross-sections. Scale bars, 5 μm (top); 2 μm (bottom). Data are mean ± s.e.m. NS, not significant; *P < 0.05, **P < 0.01. For statistics, see Supplementary Data 1.