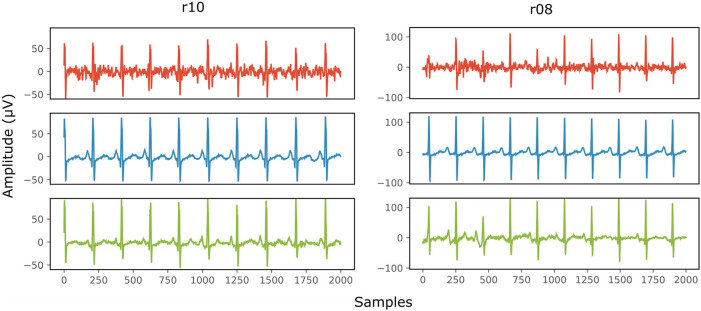
Figure 8.
Comparison of the scalp ECG with an estimation of it as a linear combination of the abdominal fetal ECG for 2 records (r10 and r08) of the Abdominal and Direct Fetal ECG Database. In the first row (red) the scalp ECG estimated from the noisy fetal ECG is presented, in the second (blue) the ECG as measured by the scalp electrode (running average of 30 complexes) and in the last one (green) the scalp ECG estimated from the denoised fetal ECG by the proposed network. The horizontal axis depicts the samples at 500 Hz, while the vertical the amplitude of the signals in μV.

