
Figure 2.
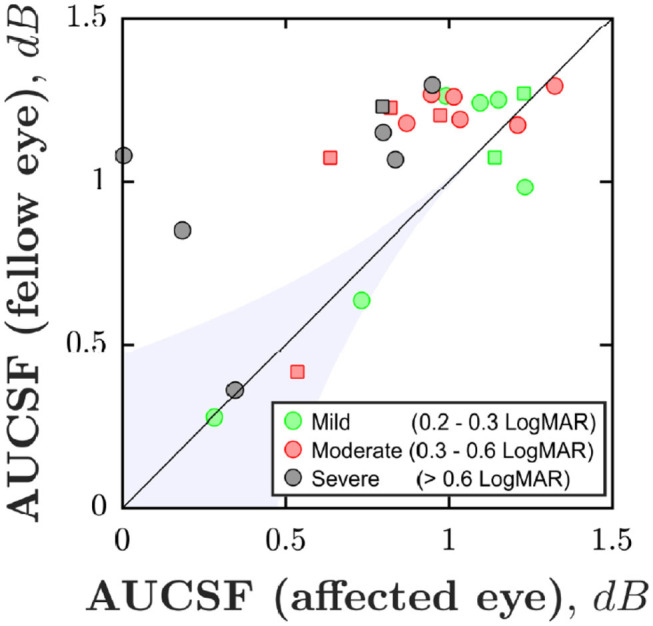
Case-control effect: Area Under the CSF (AUCSF) for each of the 25 individuals, broken down by eye. Marker color denotes amblyopia severity (as quantified by logMAR acuity in worse eye). Squares indicate cases of strabismus without anisometropia. The black line indicates unity (performance similar in both eyes). The blue shaded region of Figure 2 is for illustration only. However, points falling in a region such as this likely represent general non-compliance (poor performance in both eyes).