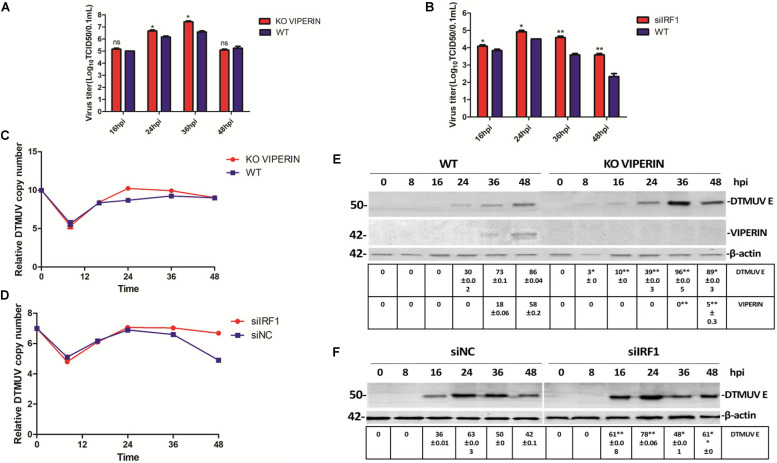
FIGURE 6.
Effect of knockdown/out of VIPERIN and IRF1 on DTMUV replication in DF-1 cells. (A) Viral titers from DTMUV-infected wild type (blue, WT) and VIPERIN-knockout DF-1 cells (red, KO VIPERIN) harvested at the indicated times, respectively. T test between the red and blue groups was done. ∗p < 0. 05; ∗∗p < 0. 01; ns, non-significance. (B) Viral titers obtained from 293T cells transfected with siNC (blue, WT) or siIRF1 (red, siIRF1), followed by DTMUV infection, and harvested at the indicated times. T test between the red and blue groups was done. ∗p < 0. 05; ∗∗p < 0. 01; ns, non-significance. (C) Relative viral RNA levels from VIPERIN-knockout (KO VIPERIN) or wild type DF-1 cells (WT) harvested at the indicated times post-DTMUV infection. (D) Relative viral RNA levels from IRF1-knockdown (siIRF1) or the negative control (siNC) 293T cells harvested at the indicated times post-DTMUV infection. (E) The E protein expressed in WT or KO VIPERIN DF-1 cells at the indicated times post-DTMUV infection. The values of E protein and VIPERIN were presented after normalized to β-actin. ∗p < 0. 05; ∗∗p < 0. 01. (F) The E protein expressed in 293-T or IRF1-knockdown 293T cells at the indicated times post-DTMUV infection. The value of E protein was presented after normalized to β-actin. ∗p < 0. 05; ∗∗p < 0. 01.

